Data Visualization Projects in Leicestershire
Visualization Techniques & Tools
Discovery Exhibition at VisWeek 2010
How the Research team at LCC are using two new visualization solutions developed by the giCentre to inform local transport planning
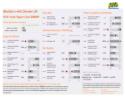
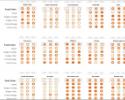
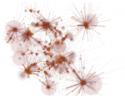
Visualising Deprivation Change
A graphic to show change between the 2004 and 2008 Indices of Deprivation
Designing Dashboards
Everyone now wants a dashboard. Understanding the basics of visual design would help improve most.
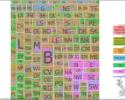
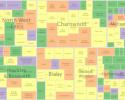
OAC Explorer
The giCentre (with a little help from LCC) won best paper at the 2010 GIS Research UK 18th Annual Conference (GISRUK)

Leicestershire dataViz Projects
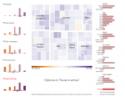
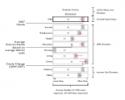
Place Survey
The place survey asked 8,500 residents across Leicestershire how well the County and District Councils and their partners, such as the Police and NHS, are doing at delivering the services that matter to you and to decide what needs doing differently.
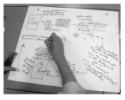
Evaluating Human-Centered Approaches for Geovisualization.
Working with LCC, David Lloyd's comprehensive piece of work details ways in which various human-centred methods can be used in establishing communication between data experts and visual methods experts to foster co-discovery through long-term collaboration.