Displaying 1 to 40 of 48

These dashboards show relative performance compared to net expenditure per head and deprivation for Leicestershire and other local authorities, with a particular focus on two-tier county and county unitary areas.

The Benchmarking Analysis compares performance and expenditure outcomes in Leicestershire with those of other local authority areas.

The report provides an update on the performance of Leicestershire County Council and partners Safer Communities services. The report covers crime, youth justice, domestic abuse and anti-social behaviour.

The report and associated dashboard/s provide an update on the performance of Leicestershire County Council's Environment & Transport Services. The report covers: waste management; the Council's environmental impact and carbon emissions.

The dashboard/s and associated report provide an update on the performance of Leicestershire County Council's Highways & Transport Services. The dashboard covers: road safety; highways maintenance; strategic transport and reducing congestion; and sustainable travel.

The report and associated dashboard provide Leicestershire County Council's update on local health and wellbeing priorities. The report covers Better Care Fund performance (including care home admissions, delayed transfers of care, falls).

Children & Families Department Performance Report Quarter 3, 2023/24
Tue, 05 Mar 2024
Richard Wilding
The report and associated dashboard provide an update on the performance of Leicestershire County Council's Children & Family Services Department. The report covers children's social care services (including child protection, children in care and care leavers), educational attainment and progression,...

Adults & Communities Department - Quarter 2, 2023/24 and Benchmarking 2022/23
Mon, 22 Jan 2024
Richard Wilding
The report and associated dashboard provide an update on the performance of Leicestershire County Council's Adults and Communities Department. The report covers adult social care services (including residential admissions, hospital discharge & reablement, personalisation and adult safeguarding),...

Alcohol‐Related Crime & The Night‐time Economy
Thu, 13 Dec 2012 11:59
This analysis has been developed as part of the work of the Leicestershire Reducing Alcohol Misuse Programme and identifies;
• the key night time economy alcohol crime hotspot areas across the County;
• a summary of the offender profiles based on police data;
• A summary of the offender profiles...

Unemployment Bulletin November 2012
Wed, 12 Dec 2012
The JSA claimant data in this bulletin is available down to ward level. The JSA data is also available broken down by the detailed ethnic groups down to Local Authority level.
The population figures used to calculate residence-based proportions (rates) have changed from working age (16-59f/64m) to aged...

Unemployment Bulletin October 2012
Wed, 14 Nov 2012
The JSA claimant data in this bulletin is available down to ward level. The JSA data is also available broken down by the detailed ethnic groups down to Local Authority level.
The population figures used to calculate residence-based proportions (rates) have changed from working age (16-59f/64m) to aged...

Crime Reduction Dashboards (September 2012)
Mon, 22 Oct 2012 09:45
The Crime Reduction Dashboards provide a visual indication of recorded crime figures against performance/reduction targets for the year-to-date. All seven districts of Leicestershire are covered along with Leicester City, and an overall view of Leicestershire and the Force Area.
For more information,...

Crime Reduction Dashboards (August 2012)
Mon, 22 Oct 2012 09:37
The Crime Reduction Dashboards provide a visual indication of recorded crime figures against performance/reduction targets for the year-to-date. All seven districts of Leicestershire are covered along with Leicester City, and an overall view of Leicestershire and the Force Area.
For more information,...
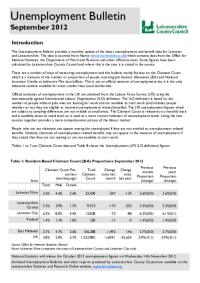
Unemployment Bulletin September 2012
Wed, 17 Oct 2012
The JSA claimant data in this bulletin is available down to ward level. The JSA data is also available broken down by the detailed ethnic groups down to Local Authority level.
The population figures used to calculate residence-based proportions (rates) have changed from working age (16-59f/64m) to aged...

Unemployment Bulletin August 2012
Wed, 12 Sep 2012
The JSA claimant data in this bulletin is available down to ward level. The JSA data is also available broken down by the detailed ethnic groups down to Local Authority level.
The population figures used to calculate residence-based proportions (rates) have changed from working age (16-59f/64m) to aged...

Crime Reduction Dashboards (July 2012)
Fri, 31 Aug 2012 11:45
The Crime Reduction Dashboards provide a visual indication of recorded crime figures against performance/reduction targets for the year-to-date. All seven districts of Leicestershire are covered along with Leicester City, and an overall view of Leicestershire and the Force Area.
For more information,...
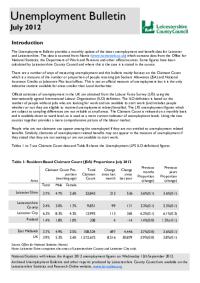
Unemployment Bulletin July 2012
Wed, 29 Aug 2012
The JSA claimant data in this bulletin is available down to ward level. The JSA data is also available broken down by the detailed ethnic groups down to Local Authority level.
The population figures used to calculate residence-based proportions (rates) have changed from working age (16-59f/64m) to aged...

Crime Reduction Dashboards (June 2012)
Mon, 30 Jul 2012 15:28
The Crime Reduction Dashboards provide a visual indication of recorded crime figures against performance/reduction targets for the year-to-date. All seven districts of Leicestershire are covered along with Leicester City, and an overall view of Leicestershire and the Force Area.
For more information,...

Unemployment Bulletin June 2012
Fri, 20 Jul 2012
The JSA claimant data in this bulletin is available down to ward level. The JSA data is also available broken down by the detailed ethnic groups down to Local Authority level.
The population figures used to calculate residence-based proportions (rates) have changed from working age (16-59f/64m) to aged...

Crime Reduction Dashboards (May 2012)
Fri, 22 Jun 2012 11:07
The Crime Reduction Dashboards provide a visual indication of recorded crime figures against performance/reduction targets for the year-to-date. All seven districts of Leicestershire are covered along with Leicester City, and an overall view of Leicestershire and the Force Area.
For more information,...

Unemployment Bulletin May 2012
Wed, 20 Jun 2012
The JSA claimant data in this bulletin is available down to ward level. The JSA data is also available broken down by the detailed ethnic groups down to Local Authority level.
The population figures used to calculate residence-based proportions (rates) have changed from working age (16-59f/64m) to aged...

Crime Reduction Dashboards (April 2012)
Mon, 11 Jun 2012 16:03
The Crime Reduction Dashboards provide a visual indication of recorded crime figures against performance/reduction targets for the year-to-date. All seven districts of Leicestershire are covered along with Leicester City, and an overall view of Leicestershire and the Force Area.
For more information,...

Unemployment Bulletin April 2012
Wed, 16 May 2012
The JSA claimant data in this bulletin is available down to ward level. The JSA data is also available broken down by the detailed ethnic groups down to Local Authority level.
The population figures used to calculate residence-based proportions (rates) have changed from working age (16-59f/64m) to aged...

Leicester and Leicestershire Business Survey - Winter 2012
Thu, 10 May 2012 14:08
The Leicester and Leicestershire Enterprise Partnership (LLEP) has published the latest edition of the Leicester and Leicestershire Business Survey. The business survey has been carried out by a partnership involving Leicestershire County Council, Leicester City Council and other key local agencies since...

Crime Reduction Dashboards (March 2012)
Thu, 03 May 2012 13:03
The Crime Reduction Dashboards provide a visual indication of recorded crime figures against performance/reduction targets for the year-to-date. All seven districts of Leicestershire are covered along with Leicester City, and an overall view of Leicestershire and the Force Area.
For more information,...

Leicestershire County Safer Communities Strategic Assessment - April 2012
Tue, 24 Apr 2012 14:13
The purpose of this document is to provide Leicestershire County Safer Communities Strategy Board (LSCSB) with a comprehensive picture of crime, anti-social behaviour and community safety issues across Leicestershire County. The report provides information on police recorded crime, anti-social behaviour...

Unemployment Bulletin March 2012
Wed, 18 Apr 2012
The JSA claimant data in this bulletin is available down to ward level. The JSA data is also available broken down by the detailed ethnic groups down to Local Authority level.
The population figures used to calculate residence-based proportions (rates) have changed from working age (16-59f/64m) to aged...

Crime Reduction Dashboards (February 2012)
Wed, 11 Apr 2012 09:10
The Crime Reduction Dashboards provide a visual indication of recorded crime figures against performance/reduction targets for the year-to-date. All seven districts of Leicestershire are covered along with Leicester City, and an overall view of Leicestershire and the Force Area.
For more information,...

Community Based Survey Results 2011/12 Q4
Wed, 04 Apr 2012 08:48
Leicestershire County Council and Leicestershire Police Authority have jointly commissioned the Community Based Survey, which replaces the previous community safety CRAVE Survey. The project combines key survey requirements of the County Council and Police Authority together into one consultation. As...

Unemployment Bulletin February 2012
Wed, 14 Mar 2012
The JSA claimant data in this bulletin is available down to ward level. The JSA data is also available broken down by the detailed ethnic groups down to Local Authority level.
The population figures used to calculate residence-based proportions (rates) have changed from working age (16-59f/64m) to aged...

Crime Reduction Dashboards (January 2012)
Fri, 24 Feb 2012 11:09
The Crime Reduction Dashboards provide a visual indication of recorded crime figures against performance/reduction targets for the year-to-date. All seven districts of Leicestershire are covered along with Leicester City, and an overall view of Leicestershire and the Force Area.
For more information,...
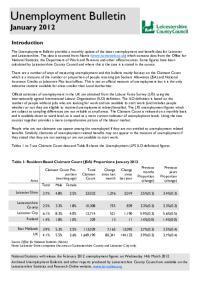
Unemployment Bulletin January 2012
Mon, 20 Feb 2012
The JSA claimant data in this bulletin is available down to ward level. The JSA data is also available broken down by the detailed ethnic groups down to Local Authority level.
The population figures used to calculate residence-based proportions (rates) have changed from working age (16-59f/64m) to aged...

Community Based Survey Results 2011/12 Q3
Mon, 13 Feb 2012 08:59
Leicestershire County Council and Leicestershire Police Authority have jointly commissioned the Community Based Survey, which replaces the previous community safety CRAVE Survey. The project combines key survey requirements of the County Council and Police Authority together into one consultation. As...

Unemployment Bulletin December 2011
Wed, 18 Jan 2012
The JSA claimant data in this bulletin is available down to ward level. The JSA data is also available broken down by the detailed ethnic groups down to Local Authority level.
The population figures used to calculate residence-based proportions (rates) have changed from working age (16-59f/64m) to aged...

Places in Leicestershire Reports 2007
Fri, 14 Dec 2007 18:40
The Places in Leicestershire reports identify and highlight the priorities for individual places in Leicestershire, based on relevant and available data sources and information. The reports form part of the evidence base for the 2008 Leicestershire Sustainable Community Strategy, enabling identification...

Unemployment Bulletin November 2007
Fri, 14 Dec 2007
The Monthly Unemployment Bulletin provides data on a number and rate of Job Seekers Allowance (JSA) claimants across Leicester Shire.
The JSA claimant data in this bulletin is available down to ward level. The JSA data is also available broken down by the detailed ethnic groups down to Local Authority...

Unemployment Bulletin October 2007
Tue, 20 Nov 2007
The Monthly Unemployment Bulletin provides data on a number and rate of Job Seekers Allowance (JSA) claimants across Leicester Shire.
The JSA claimant data in this bulletin is available down to ward level. The JSA data is also available broken down by the detailed ethnic groups down to Local Authority...

Unemployment Bulletin September 2007
Tue, 20 Nov 2007
The monthly Unemployment Bulletin provides data on number and rate of Job Seekers Allowance (JSA) claimants across Leicester Shire.
The JSA claimant data in this bulletin is available down to ward level. The JSA data is also available broken down by the detailed ethnic groups down to Local Authority level....

Indices of Deprivation 2004 - Key Findings
Thu, 01 Nov 2007
The Indices of Deprivation 2004 are produced by the Office of the Deputy Prime Minister (ODPM). They are an attempt to measure deprivation in a consistent way for small areas across England. The following documents cover the individual districts of Leicestershire and Leicestershire county as a whole....

Unemployment Bulletin August 2007
Mon, 24 Sep 2007
The monthly Unemployment Bulletin provides data on number and rate of Job Seekers Allowance (JSA) claimants across Leicester Shire.
The JSA claimant data in this bulletin is available down to ward level. The JSA data is also available broken down by the detailed ethnic groups down to Local Authority level....