Displaying 1 to 26 of 26

Anti-Social Behaviour Dashboard (October 2010)
Thu, 18 Nov 2010 14:20
The Anti-Social Behaviour (ASB) Dashboard provides a visual indication of the number of recorded ASB incidents against the previous year-to-date targets and long-term average. ASB incidents are broken down by category: Rowdy or Inconsiderate Behaviour, Vehicle Nuisance and Inappropriate Behaviour, Hoax...

Crime Reduction Dashboards (October 2010)
Thu, 18 Nov 2010 14:13
The Crime Reduction Dashboards provide a visual indication of recorded crime figures against performance/reduction targets for the year-to-date. All seven districts of Leicestershire are covered along with Leicester City, and an overall view of Leicestershire and the Force Area. The local reduction targets...

Partnership Strategic Assessment 2010-11
Mon, 15 Nov 2010 13:37
The Partnership Strategic Assessment for Leicester, Leicestershire and Rutland brings together information regarding crime, disorder and community safety from across partner agencies to identify the longer-term issues impacting on Leicester, Leicestershire and Rutland, as well as the scope of, and projections...

Crime Reduction Dashboards (September 2010)
Wed, 20 Oct 2010 14:02
The Crime Reduction Dashboards provide a visual indication of recorded crime figures against performance/reduction targets for the year-to-date. All seven districts of Leicestershire are covered along with Leicester City, and an overall view of Leicestershire and the Force Area. The local reduction targets...

Anti-Social Behaviour Dashboard (September 2010)
Wed, 20 Oct 2010 14:01
The Anti-Social Behaviour (ASB) Dashboard provides a visual indication of the number of recorded ASB incidents against the previous year-to-date targets and long-term average. ASB incidents are broken down by category: Rowdy or Inconsiderate Behaviour, Vehicle Nuisance and Inappropriate Behaviour, Hoax...

Crime Reduction Dashboards (August 2010)
Mon, 11 Oct 2010 07:37
The Crime Reduction Dashboards provide a visual indication of recorded crime figures against performance/reduction targets for the year-to-date. All seven districts of Leicestershire are covered along with Leicester City, and an overall view of Leicestershire and the Force Area. The local reduction targets...

Anti-Social Behaviour Dashboard (August 2010)
Mon, 11 Oct 2010 07:36
The Anti-Social Behaviour (ASB) Dashboard provides a visual indication of the number of recorded ASB incidents against the previous year-to-date targets and long-term average. ASB incidents are broken down by category: Rowdy or Inconsiderate Behaviour, Vehicle Nuisance and Inappropriate Behaviour, Hoax...

Anti-Social Behaviour Dashboard (July 2010)
Fri, 20 Aug 2010 13:53
The Anti-Social Behaviour (ASB) Dashboard provides a visual indication of the number of recorded ASB incidents against the previous year-to-date targets and long-term average. ASB incidents are broken down by category: Rowdy or Inconsiderate Behaviour, Vehicle Nuisance and Inappropriate Behaviour, Hoax...

Crime Reduction Dashboards (July 2010)
Fri, 20 Aug 2010 13:45
The Crime Reduction Dashboards provide a visual indication of recorded crime figures against performance/reduction targets for the year-to-date. All seven districts of Leicestershire are covered along with Leicester City, and an overall view of Leicestershire and the Force Area. The local reduction targets...
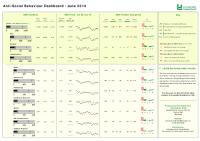
Anti-Social Behaviour Dashboard (June 2010)
Tue, 20 Jul 2010 15:19
The Anti-Social Behaviour (ASB) Dashboard provides a visual indication of the number of recorded ASB incidents against the previous year-to-date targets and long-term average. ASB incidents are broken down by category: Rowdy or Inconsiderate Behaviour, Vehicle Nuisance and Inappropriate Behaviour, Hoax...
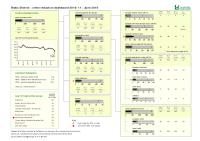
Crime Reduction Dashboards (June 2010)
Tue, 20 Jul 2010 15:14
The Crime Reduction Dashboards provide a visual indication of recorded crime figures against performance/reduction targets for the year-to-date. All seven districts of Leicestershire are covered along with Leicester City, and an overall view of Leicestershire and the Force Area. The local reduction targets...

Anti-Social Behaviour Dashboard (May 2010)
Wed, 30 Jun 2010 13:32
The Anti-Social Behaviour (ASB) Dashboard provides a visual indication of the number of recorded ASB incidents against the previous year-to-date targets and long-term average. ASB incidents are broken down by category: Rowdy or Inconsiderate Behaviour, Vehicle Nuisance and Inappropriate Behaviour, Hoax...

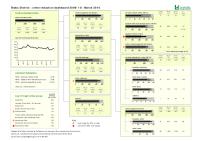
Crime Reduction Dashboards (May 2010)
Wed, 30 Jun 2010 13:25
The Crime Reduction Dashboards provide a visual indication of recorded crime figures against performance/reduction targets for the year-to-date. All seven districts of Leicestershire are covered along with Leicester City, and an overall view of Leicestershire and the Force Area. The local reduction targets...
Crime Reduction Dashboards (Year End 2009/10)
Thu, 15 Apr 2010 17:13
The Crime Reduction Dashboards provide a visual indication of recorded crime figures against performance/reduction targets for the year-to-date. All seven districts of Leicestershire are covered along with Leicester City, and an overall view of Leicestershire and the Force Area. The local reduction targets...

Anti-Social Behaviour Dashboard (Year End 2009/10)
Thu, 15 Apr 2010 17:11
The Anti-Social Behaviour (ASB) Dashboard provides a visual indication of the number of recorded ASB incidents against the previous year-to-date targets and long-term average. ASB incidents are broken down by category: Rowdy or Inconsiderate Behaviour, Vehicle Nuisance and Inappropriate Behaviour, Hoax...

Leicester and Leicestershire House Price and Sales Volume Monthly bulletin (October '09)
Mon, 28 Sep 2009 12:00
Using sales data, sourced from The Land Registry House Price Index (HPI), this report outlines house price and sales trends during a specified 12 month period. The HPI captures changes in the value of residential properties by analysing sales data collected on all residential housing transactions, whether...

Leicestershire Community Safety Partnership Strategic Assessment 2009
Wed, 23 Sep 2009 11:31
The Partnership Strategic Assessment provides a summary of the crime, disorder and substance misuse issues across Leicestershire during 2008/09. The information within this assessment is designed to aid the Leicestershire Safer Communities Strategy Board to review current and develop future strategic...

Crime Reduction Dashboards (Year End 2008/9)
Mon, 08 Jun 2009 10:36
The Crime Reduction Dashboards provide a visual indication of recorded crime figures against performance/reduction targets. All seven districts of Leicestershire are covered along with Leicester City, and an overall view of Leicestershire and the Force Area.
For more information, please contact:
Karen...

Leicester and Leicestershire House Price by Household Type (Jan 08 - Jan 09)
Mon, 23 Mar 2009 15:00
Using sales data sourced from The Land Registry House Price Index this report showcases trends for the 12 calendar months prior to January 2009. The HPI captures changes in the value of residential properties by analysing sales data collected on all residential housing transactions, whether for cash...

Social Capital Survey 2007
Wed, 11 Feb 2009 15:58
As part of the Stronger Communities Block of the Leicestershire Local Area Agreement (LAA), the Communities and Voluntary Sector (CVS), DeMontfort University and Leicestershire County Council conducted a survey that attempted to baseline levels of social capital in 20 areas across Leicestershire.
Social...

Places in Leicestershire Reports 2007
Fri, 14 Dec 2007 18:40
The Places in Leicestershire reports identify and highlight the priorities for individual places in Leicestershire, based on relevant and available data sources and information. The reports form part of the evidence base for the 2008 Leicestershire Sustainable Community Strategy, enabling identification...

Active People KPI1 small area estimates for Melton
Mon, 10 Dec 2007 14:20
The Active People Survey is the largest ever survey of sport and active recreation to be undertaken by Sport England in Europe. Key Performance Indicator (KPI) #1 is the numbers of people participating moderately in physical activity for thirty minutes three times a week. This thematic map of the Melton...

Indices of Deprivation 2004 - Key Findings
Thu, 01 Nov 2007
The Indices of Deprivation 2004 are produced by the Office of the Deputy Prime Minister (ODPM). They are an attempt to measure deprivation in a consistent way for small areas across England. The following documents cover the individual districts of Leicestershire and Leicestershire county as a whole....

Melton Priority Neighbourhood profile: South Melton (Zone 3)
Thu, 14 Jun 2007 13:05
The Melton Priority Neighbourhood Profile for Zone 3 (South Melton) is now available...
The Melton Priority Neighbourhood Profile for South Melton (Zone 3) is now available. This profile provides a comprehensive overview of the South Melton priority neighbourhood. The report covers a range of useful baseline...

Melton Priority Neighbourhood Profile: Town Centre Flats (Zone 2)
Thu, 24 May 2007 13:17
The Melton Priority Neighbourhood Profile for Zone 2 (Town Centre Flats) is now available...
The Melton Priority Neighbourhood Profile for Town Centre Flats (Zone 2) is now available. This profile provides a comprehensive overview of the Town Centre Flats priority neighbourhood. The report covers a range...

Melton Priority Neighbourhood Profile: Egerton/Fairmead
Thu, 08 Feb 2007 14:28
The Melton Priority Neighbourhood Profile for Egerton/Fairmead is now available.
This profile provides a comprehensive overview of the Egerton/Fairmead priority neighbourhood. The report covers a range of useful baseline statistics for the area including information on demographics, deprivation, crime,...