Displaying 1 to 19 of 19

The Annual Performance Compendium contains service performance data including comparative performance. The dashboards focus on performance against the Council's priorities as set out in the Council Strategic Plan.

The Annual Delivery Report covers Leicestershire County Council's performance. It describes progress with implementing agreed plans and achievements over the last 12 months. It focuses on performance against County Council priorities as set out in the Council Strategic Plan and other main service strategies....

Safer Communities Performance Report Q2 2021-22
Fri, 10 Dec 2021
Leicestershire County Council - Safer Communities Performance Report Q2 2021-22
The report and associated dashboards provide an update on Leicestershire County Council's Enabling Economic Growth and Safer Communities priorities. It also covers performance on corporate areas not covered by the other scrutiny...

Safer Communities Performance Report Q1 2021-22
Fri, 24 Sep 2021
Leicestershire County Council - Safer Communities Performance Report Q1 2021-22
The report and associated dashboards provide an update on Leicestershire County Council's Enabling Economic Growth and Safer Communities priorities. It also covers performance on corporate areas not covered by the other scrutiny...

Safer Communities Performance Report Q4 2020/21
Fri, 18 Jun 2021
Leicestershire County Council Safer Communities Report Q4 2020/21
The report and associated dashboards provide an update on Leicestershire County Council's Enabling Economic Growth and Safer Communities priorities. It also covers performance on corporate areas not covered by the other scrutiny committees...

The following report provides a summary of a broad range of socioeconomic information for Leicestershire, covering the following topics:
- Population
- Economy
- Area Classifications
- Health
A brief commentary is included, along with links to further information. The report will be updated periodically as new data...

Leicestershire County Council Benchmarking Analysis 2019/20
Tue, 09 Mar 2021
Leicestershire County Council
Leicestershire County Council Benchmarking Analysis 2019/20
The Benchmarking Analysis 2019/20 compares performance outcomes in Leicestershire
with those of other local authority areas.

Unemployment Bulletin November 2013
Wed, 18 Dec 2013
The monthly unemployment bulletin contains a range of unemployment related statistics, covering Leicester, Leicestershire and Rutland. The JSA claimant data in this bulletin is available down to ward level. The JSA data is also available broken down by the detailed ethnic groups down to Local Authority...
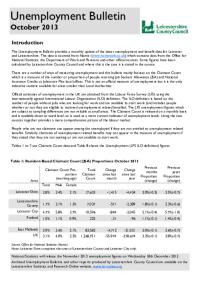
Unemployment Bulletin October 2013
Thu, 14 Nov 2013
The monthly unemployment bulletin contains a range of unemployment related statistics, covering Leicester, Leicestershire and Rutland. The JSA claimant data in this bulletin is available down to ward level. The JSA data is also available broken down by the detailed ethnic groups down to Local Authority...
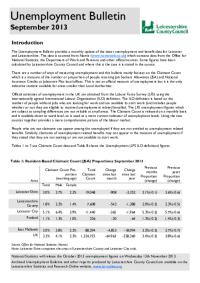
Unemployment Bulletin September 2013
Thu, 17 Oct 2013
The JSA claimant data in this bulletin is available down to ward level. The JSA data is also available broken down by the detailed ethnic groups down to Local Authority level.
The population figures used to calculate residence-based proportions (rates) have changed from working age (16-59f/64m) to aged...

Unemployment Bulletin August 2013
Wed, 11 Sep 2013
The JSA claimant data in this bulletin is available down to ward level. The JSA data is also available broken down by the detailed ethnic groups down to Local Authority level.
The population figures used to calculate residence-based proportions (rates) have changed from working age (16-59f/64m) to aged...
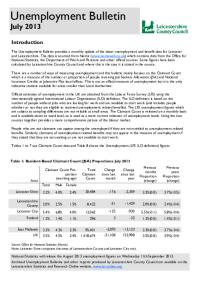
Unemployment Bulletin July 2013
Mon, 02 Sep 2013
The JSA claimant data in this bulletin is available down to ward level. The JSA data is also available broken down by the detailed ethnic groups down to Local Authority level.
The population figures used to calculate residence-based proportions (rates) have changed from working age (16-59f/64m) to aged...

Unemployment Bulletin June 2013
Wed, 17 Jul 2013
The JSA claimant data in this bulletin is available down to ward level. The JSA data is also available broken down by the detailed ethnic groups down to Local Authority level.
The population figures used to calculate residence-based proportions (rates) have changed from working age (16-59f/64m) to aged...

Unemployment Bulletin May 2013
Thu, 13 Jun 2013
The JSA claimant data in this bulletin is available down to ward level. The JSA data is also available broken down by the detailed ethnic groups down to Local Authority level.
The population figures used to calculate residence-based proportions (rates) have changed from working age (16-59f/64m) to aged...
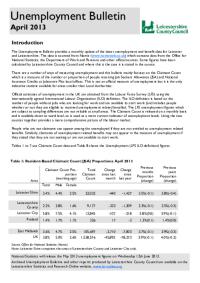
Unemployment Bulletin April 2013
Wed, 15 May 2013
The JSA claimant data in this bulletin is available down to ward level. The JSA data is also available broken down by the detailed ethnic groups down to Local Authority level.
The population figures used to calculate residence-based proportions (rates) have changed from working age (16-59f/64m) to aged...

Unemployment Bulletin March 2013
Thu, 18 Apr 2013
The JSA claimant data in this bulletin is available down to ward level. The JSA data is also available broken down by the detailed ethnic groups down to Local Authority level.
The population figures used to calculate residence-based proportions (rates) have changed from working age (16-59f/64m) to aged...

Unemployment Bulletin February 2013
Wed, 20 Mar 2013
The JSA claimant data in this bulletin is available down to ward level. The JSA data is also available broken down by the detailed ethnic groups down to Local Authority level.
The population figures used to calculate residence-based proportions (rates) have changed from working age (16-59f/64m) to aged...

Unemployment Bulletin January 2013
Wed, 20 Feb 2013
The JSA claimant data in this bulletin is available down to ward level. The JSA data is also available broken down by the detailed ethnic groups down to Local Authority level.
The population figures used to calculate residence-based proportions (rates) have changed from working age (16-59f/64m) to aged...

Unemployment Bulletin December 2012
Wed, 23 Jan 2013
The JSA claimant data in this bulletin is available down to ward level. The JSA data is also available broken down by the detailed ethnic groups down to Local Authority level.
The population figures used to calculate residence-based proportions (rates) have changed from working age (16-59f/64m) to aged...