Displaying 1 to 32 of 32

The Annual Performance Compendium contains service performance data including comparative performance. The dashboards focus on performance against the Council's priorities as set out in the Council Strategic Plan.

The Annual Delivery Report covers Leicestershire County Council's performance. It describes progress with implementing agreed plans and achievements over the last 12 months. It focuses on performance against County Council priorities as set out in the Council Strategic Plan and other main service strategies....

Safer Communities Performance Report Q2 2021-22
Fri, 10 Dec 2021
Leicestershire County Council - Safer Communities Performance Report Q2 2021-22
The report and associated dashboards provide an update on Leicestershire County Council's Enabling Economic Growth and Safer Communities priorities. It also covers performance on corporate areas not covered by the other scrutiny...

Safer Communities Performance Report Q1 2021-22
Fri, 24 Sep 2021
Leicestershire County Council - Safer Communities Performance Report Q1 2021-22
The report and associated dashboards provide an update on Leicestershire County Council's Enabling Economic Growth and Safer Communities priorities. It also covers performance on corporate areas not covered by the other scrutiny...

Safer Communities Performance Report Q4 2020/21
Fri, 18 Jun 2021
Leicestershire County Council Safer Communities Report Q4 2020/21
The report and associated dashboards provide an update on Leicestershire County Council's Enabling Economic Growth and Safer Communities priorities. It also covers performance on corporate areas not covered by the other scrutiny committees...

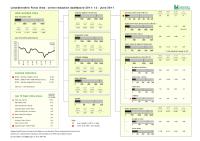
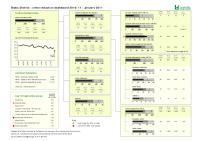
Leicestershire County Council Benchmarking Analysis 2019/20
Tue, 09 Mar 2021
Leicestershire County Council
Leicestershire County Council Benchmarking Analysis 2019/20
The Benchmarking Analysis 2019/20 compares performance outcomes in Leicestershire
with those of other local authority areas.

Hate Incident Monitoring Project Dashboard: Quarter 2 – 2016/17
Wed, 09 Nov 2016
Leicestershire County Council
The Hate Incident Monitoring Project (HIMP) data is available as an interactive dashboard.
A PDF version can be downloaded below.
The Hate Incident Monitoring Project Dashboard provides a quarterly summary of the number of hate incidents reported to the Police and HIMP as well as maps showing hate incident...

Domestic Abuse data is now available as an interactive dashboard.
A PDF version can be downloaded below.
The Domestic Abuse Dashboard provides a visual indication of recorded offences and non-recordable incidents of domestic abuse reported to the Police in Leicestershire County for the current year-to-date...

Hate Incident Monitoring Project Dashboard: Quarter4 – 2015/16
Thu, 12 May 2016
The Hate Incident Monitoring Project (HIMP) data is available as an interactive dashboard.
A PDF version can be downloaded below.
The Hate Incident Monitoring Project Dashboard provides a quarterly summary of the number of hate incidents reported to the Police and HIMP as well as maps showing hate incident...

Domestic Abuse Dashboard: Quarter 4 - 2015/16
Thu, 12 May 2016
Domestic Abuse data is now available as an interactive dashboard.
A PDF version can be downloaded below.
The Domestic Abuse Dashboard provides a visual indication of recorded offences and non-recordable incidents of domestic abuse reported to the Police in Leicestershire County for the current year-to-date...

Community Based Survey Results 2011/12 Q2
Thu, 01 Dec 2011 16:11
Leicestershire County Council and Leicestershire Police Authority have jointly commissioned the Community Based Survey, which replaces the previous community safety CRAVE Survey. The project combines key survey requirements of the County Council and Police Authority together into one consultation. As...

Anti-Social Behaviour Dashboard (October 2011)
Fri, 25 Nov 2011 11:52
The Anti-Social Behaviour (ASB) Dashboard provides a visual indication of the number of recorded ASB incidents against the previous year-to-date and long-term average. ASB incidents are broken down into three categories: personal, nuisance and environmental. All seven districts of Leicestershire are...

Crime Reduction Dashboards (October 2011)
Thu, 24 Nov 2011 17:07
The Crime Reduction Dashboards provide a visual indication of recorded crime figures against performance/reduction targets for the year-to-date. All seven districts of Leicestershire are covered along with Leicester City, and an overall view of Leicestershire and the Force Area.
For more information,...

Hate Incident Monitoring Project Dashboard
Tue, 22 Nov 2011 14:11
The Hate Incident Monitoring Project Dashboard provides a quarterly summary of the number of hate incidents reported to the Police and to the HIMP (and Leicestershire Schools - Quarter 4 only). The dashboard provides an indication of the progress towards the target to increase the reporting of hate incidents...

Report : Crime Reduction Dashboards (September 2011)
Tue, 08 Nov 2011 12:52
The Crime Reduction Dashboards provide a visual indication of recorded crime figures against performance/reduction targets for the year-to-date. All seven districts of Leicestershire are covered along with Leicester City, and an overall view of Leicestershire and the Force Area. The local reduction targets...

Report : Anti-Social Behaviour Dashboard (September 2011)
Tue, 08 Nov 2011 12:50
The Anti-Social Behaviour (ASB) Dashboard provides a visual indication of the number of recorded ASB incidents against the previous year-to-date and long-term average. ASB incidents are broken down into three categories: personal, nuisance and environmental. All seven districts of Leicestershire are...

Report : Anti-Social Behaviour Dashboard (July 2011)
Fri, 02 Sep 2011 10:32
The Anti-Social Behaviour (ASB) Dashboard provides a visual indication of the number of recorded ASB incidents against the previous year-to-date and long-term average. ASB incidents are broken down into three categories: personal, nuisance and environmental. All seven districts of Leicestershire are...

Crime Reduction Dashboards (July 2011)
Fri, 02 Sep 2011 09:18
The Crime Reduction Dashboards provide a visual indication of recorded crime figures against performance/reduction targets for the year-to-date. All seven districts of Leicestershire are covered along with Leicester City, and an overall view of Leicestershire and the Force Area. The local reduction targets...
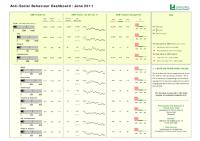
Report : Anti-Social Behaviour Dashboard (June 2011)
Thu, 04 Aug 2011 09:22
The Anti-Social Behaviour (ASB) Dashboard provides a visual indication of the number of recorded ASB incidents against the previous year-to-date and long-term average. ASB incidents are broken down into three categories: personal, nuisance and environmental. All seven districts of Leicestershire are...
Crime Reduction Dashboards (June 2011)
Thu, 28 Jul 2011 16:15
The Crime Reduction Dashboards provide a visual indication of recorded crime figures against performance/reduction targets for the year-to-date. All seven districts of Leicestershire are covered along with Leicester City, and an overall view of Leicestershire and the Force Area. The local reduction targets...

Anti-Social Behaviour Dashboard (May 2011)
Fri, 15 Jul 2011 15:00
The Anti-Social Behaviour (ASB) Dashboard provides a visual indication of the number of recorded ASB incidents against the previous year-to-date and long-term average. ASB incidents are broken down into three categories: personal, nuisance and environmental. All seven districts of Leicestershire are...

Crime Reduction Dashboards (May 2011)
Fri, 15 Jul 2011 08:53
The Crime Reduction Dashboards provide a visual indication of recorded crime figures against performance/reduction targets for the year-to-date. All seven districts of Leicestershire are covered along with Leicester City, and an overall view of Leicestershire and the Force Area. The local reduction targets...

Crime Reduction Dashboards (March 2011)
Tue, 26 Apr 2011 17:39
The Crime Reduction Dashboards provide a visual indication of recorded crime figures against performance/reduction targets for the year-to-date. All seven districts of Leicestershire are covered along with Leicester City, and an overall view of Leicestershire and the Force Area. The local reduction targets...

Anti-Social Behaviour Dashboard (March 2011)
Tue, 26 Apr 2011 17:35
The Anti-Social Behaviour (ASB) Dashboard provides a visual indication of the number of recorded ASB incidents against the previous year-to-date targets and long-term average. ASB incidents are broken down by category: Rowdy or Inconsiderate Behaviour, Vehicle Nuisance and Inappropriate Behaviour, Hoax...
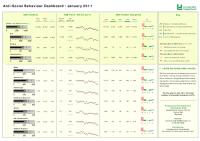
Anti-Social Behaviour Dashboard (January 2011)
Tue, 01 Mar 2011 09:27
The Anti-Social Behaviour (ASB) Dashboard provides a visual indication of the number of recorded ASB incidents against the previous year-to-date targets and long-term average. ASB incidents are broken down by category: Rowdy or Inconsiderate Behaviour, Vehicle Nuisance and Inappropriate Behaviour, Hoax...
Crime Reduction Dashboards (January 2011)
Tue, 01 Mar 2011 09:14
The Crime Reduction Dashboards provide a visual indication of recorded crime figures against performance/reduction targets for the year-to-date. All seven districts of Leicestershire are covered along with Leicester City, and an overall view of Leicestershire and the Force Area. The local reduction targets...

Anti-Social Behaviour Dashboard (December 2010)
Fri, 28 Jan 2011 10:48
The Anti-Social Behaviour (ASB) Dashboard provides a visual indication of the number of recorded ASB incidents against the previous year-to-date targets and long-term average. ASB incidents are broken down by category: Rowdy or Inconsiderate Behaviour, Vehicle Nuisance and Inappropriate Behaviour, Hoax...

Crime Reduction Dashboards (December 2010)
Thu, 27 Jan 2011 16:50
The Crime Reduction Dashboards provide a visual indication of recorded crime figures against performance/reduction targets for the year-to-date. All seven districts of Leicestershire are covered along with Leicester City, and an overall view of Leicestershire and the Force Area. The local reduction targets...

Anti-Social Behaviour Dashboard (November 2010)
Mon, 10 Jan 2011 14:58
The Anti-Social Behaviour (ASB) Dashboard provides a visual indication of the number of recorded ASB incidents against the previous year-to-date targets and long-term average. ASB incidents are broken down by category: Rowdy or Inconsiderate Behaviour, Vehicle Nuisance and Inappropriate Behaviour, Hoax...

Crime Reduction Dashboards (November 2010)
Mon, 10 Jan 2011 14:50
The Crime Reduction Dashboards provide a visual indication of recorded crime figures against performance/reduction targets for the year-to-date. All seven districts of Leicestershire are covered along with Leicester City, and an overall view of Leicestershire and the Force Area. The local reduction targets...