Displaying 81 to 85 of 85
Crime Reduction Dashboards (January 2011)
Tue, 01 Mar 2011 09:14
The Crime Reduction Dashboards provide a visual indication of recorded crime figures against performance/reduction targets for the year-to-date. All seven districts of Leicestershire are covered along with Leicester City, and an overall view of Leicestershire and the Force Area. The local reduction targets...

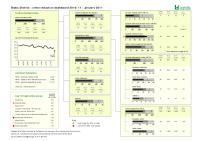
Anti-Social Behaviour Dashboard (December 2010)
Fri, 28 Jan 2011 10:48
The Anti-Social Behaviour (ASB) Dashboard provides a visual indication of the number of recorded ASB incidents against the previous year-to-date targets and long-term average. ASB incidents are broken down by category: Rowdy or Inconsiderate Behaviour, Vehicle Nuisance and Inappropriate Behaviour, Hoax...

Crime Reduction Dashboards (December 2010)
Thu, 27 Jan 2011 16:50
The Crime Reduction Dashboards provide a visual indication of recorded crime figures against performance/reduction targets for the year-to-date. All seven districts of Leicestershire are covered along with Leicester City, and an overall view of Leicestershire and the Force Area. The local reduction targets...

Anti-Social Behaviour Dashboard (November 2010)
Mon, 10 Jan 2011 14:58
The Anti-Social Behaviour (ASB) Dashboard provides a visual indication of the number of recorded ASB incidents against the previous year-to-date targets and long-term average. ASB incidents are broken down by category: Rowdy or Inconsiderate Behaviour, Vehicle Nuisance and Inappropriate Behaviour, Hoax...

Crime Reduction Dashboards (November 2010)
Mon, 10 Jan 2011 14:50
The Crime Reduction Dashboards provide a visual indication of recorded crime figures against performance/reduction targets for the year-to-date. All seven districts of Leicestershire are covered along with Leicester City, and an overall view of Leicestershire and the Force Area. The local reduction targets...