Displaying 1 to 40 of 128

A&C Performance Report Q1 2017-18 Appendix A-B-C
Tue, 12 Sep 2017
Leicestershire County Council - Adults & Communities Performance Dashboards Q1 2017/18.
The dashboard and associated report provide an update on the performance of Leicestershire County Council's Adults and Communities Department. The dashboard covers adult social care services (including residential...

A&C Performance Report Q1 2017-18
Tue, 12 Sep 2017
Leicestershire County Council - Adults & Communities Performance Report Q1 2017-18.
The report and associated dashboard provide an update on the performance of Leicestershire County Council's Adults and Communities Department. The report covers adult social care services (including residential admissions,...

Children & Families Performance Report Q1 2017-18
Mon, 11 Sep 2017
Leicestershire County Council - Children & Families Performance Report Q1 2017-18.
The report and associated dashboard provide an update on the performance of Leicestershire County Council's Children & Families Department. The report covers children's social care services (including child protection,...

Children & Families Performance Dashboards Q1 2017-18
Mon, 11 Sep 2017
Leicestershire County Council - Children & Families Performance Dashboards Q1 2017-18.
The dashboard and associated report provide an update on the performance of Leicestershire County Council's Children & Families Department. The dashboard covers children's social care services (including child...

Environment & Transport Performance Report Q1 2017-18
Thu, 07 Sep 2017
Leicestershire County Council - Environment & Transport Performance Report Q1 207-18.
The report and associated dashboard/s provide an update on the performance of Leicestershire County Council's Environment & Transport Department. The report covers: waste management; the Council's environmental...
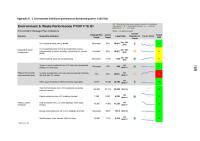
Environment & Transport Performance Report Q1 2017-18 Appendix A-B
Thu, 07 Sep 2017
Leicestershire County Council - Performance Dashboards Q1 2017-18 Appendix A-B.
The dashboard/s and associated report provide an update on the performance of Leicestershire County Council's Environment & Transport Department. The dashboard covers: waste management; the Council's environmental
impact...

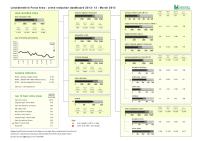
Unemployment Bulletin May 2018
Wed, 13 Jun 2018
The monthly unemployment bulletin contains a range of unemployment related statistics, covering Leicester, Leicestershire and Rutland. The JSA claimant data in this bulletin is available down to ward level. The JSA data is also available broken down by the detailed ethnic groups down to Local Authority...

Hate Incident Monitoring Project Dashboard
Tue, 22 Nov 2011 14:11
The Hate Incident Monitoring Project Dashboard provides a quarterly summary of the number of hate incidents reported to the Police and to the HIMP (and Leicestershire Schools - Quarter 4 only). The dashboard provides an indication of the progress towards the target to increase the reporting of hate incidents...

Crime Reduction Dashboards (January 2012)
Fri, 24 Feb 2012 11:09
The Crime Reduction Dashboards provide a visual indication of recorded crime figures against performance/reduction targets for the year-to-date. All seven districts of Leicestershire are covered along with Leicester City, and an overall view of Leicestershire and the Force Area.
For more information,...

Crime Reduction Dashboards (February 2012)
Wed, 11 Apr 2012 09:10
The Crime Reduction Dashboards provide a visual indication of recorded crime figures against performance/reduction targets for the year-to-date. All seven districts of Leicestershire are covered along with Leicester City, and an overall view of Leicestershire and the Force Area.
For more information,...

Crime Reduction Dashboards (March 2012)
Thu, 03 May 2012 13:03
The Crime Reduction Dashboards provide a visual indication of recorded crime figures against performance/reduction targets for the year-to-date. All seven districts of Leicestershire are covered along with Leicester City, and an overall view of Leicestershire and the Force Area.
For more information,...

Crime Reduction Dashboards (April 2012)
Mon, 11 Jun 2012 16:03
The Crime Reduction Dashboards provide a visual indication of recorded crime figures against performance/reduction targets for the year-to-date. All seven districts of Leicestershire are covered along with Leicester City, and an overall view of Leicestershire and the Force Area.
For more information,...

Crime Reduction Dashboards (May 2012)
Fri, 22 Jun 2012 11:07
The Crime Reduction Dashboards provide a visual indication of recorded crime figures against performance/reduction targets for the year-to-date. All seven districts of Leicestershire are covered along with Leicester City, and an overall view of Leicestershire and the Force Area.
For more information,...

Crime Reduction Dashboards (June 2012)
Mon, 30 Jul 2012 15:28
The Crime Reduction Dashboards provide a visual indication of recorded crime figures against performance/reduction targets for the year-to-date. All seven districts of Leicestershire are covered along with Leicester City, and an overall view of Leicestershire and the Force Area.
For more information,...

Crime Reduction Dashboards (July 2012)
Fri, 31 Aug 2012 11:45
The Crime Reduction Dashboards provide a visual indication of recorded crime figures against performance/reduction targets for the year-to-date. All seven districts of Leicestershire are covered along with Leicester City, and an overall view of Leicestershire and the Force Area.
For more information,...

Crime Reduction Dashboards (August 2012)
Mon, 22 Oct 2012 09:37
The Crime Reduction Dashboards provide a visual indication of recorded crime figures against performance/reduction targets for the year-to-date. All seven districts of Leicestershire are covered along with Leicester City, and an overall view of Leicestershire and the Force Area.
For more information,...

Crime Reduction Dashboards (September 2012)
Mon, 22 Oct 2012 09:45
The Crime Reduction Dashboards provide a visual indication of recorded crime figures against performance/reduction targets for the year-to-date. All seven districts of Leicestershire are covered along with Leicester City, and an overall view of Leicestershire and the Force Area.
For more information,...

Anti-Social Behaviour Dashboard (Oct 2012)
Thu, 31 Jan 2013 10:12
The Anti-Social Behaviour (ASB) Dashboard provides a visual indication of the number of recorded ASB incidents against the previous year-to-date and long-term average. ASB incidents are broken down into three categories: personal, nuisance and environmental. All seven districts of Leicestershire are...

Anti-Social Behaviour Dashboard (Nov 2012)
Thu, 31 Jan 2013 10:14
The Anti-Social Behaviour (ASB) Dashboard provides a visual indication of the number of recorded ASB incidents against the previous year-to-date and long-term average. ASB incidents are broken down into three categories: personal, nuisance and environmental. All seven districts of Leicestershire are...

Anti-Social Behaviour Dashboard (Dec 2012)
Thu, 31 Jan 2013 10:21
The Anti-Social Behaviour (ASB) Dashboard provides a visual indication of the number of recorded ASB incidents against the previous year-to-date and long-term average. ASB incidents are broken down into three categories: personal, nuisance and environmental. All seven districts of Leicestershire are...

Crime Reduction Dashboards (December 2012)
Thu, 31 Jan 2013 10:25
The Crime Reduction Dashboards provide a visual indication of recorded crime figures against performance/reduction targets for the year-to-date. All seven districts of Leicestershire are covered along with Leicester City, and an overall view of Leicestershire and the Force Area.
For more information,...

Domestic Abuse Dashboard: Quarter 3 - 2012/13
Fri, 01 Feb 2013 10:29
The Domestic Abuse Dashboard provides a visual indication of recorded offences and non-recordable incidents of domestic abuse reported to the Police in Leicestershire County for the current year-to-date compared to the same period last year. Figures are provided for all seven districts of Leicestershire....

Community Based Survey Results 2012/13 Q3
Fri, 01 Feb 2013 14:17
Leicestershire County Council and Leicestershire Police Authority have jointly commissioned the Community Based Survey, which replaces the previous community safety CRAVE Survey. The project combines key survey requirements of the County Council and Police Authority together into one consultation. As...

Crime Reduction Dashboards (January 2013)
Tue, 05 Mar 2013 14:16
The Crime Reduction Dashboards provide a visual indication of recorded crime figures against performance/reduction targets for the year-to-date. All seven districts of Leicestershire are covered along with Leicester City, and an overall view of Leicestershire and the Force Area.
For more information,...

Anti-Social Behaviour Dashboard (January 2013)
Tue, 05 Mar 2013 14:18
The Anti-Social Behaviour (ASB) Dashboard provides a visual indication of the number of recorded ASB incidents against the previous year-to-date and long-term average. ASB incidents are broken down into three categories: personal, nuisance and environmental. All seven districts of Leicestershire are...

Anti-Social Behaviour Dashboard (February 2013)
Fri, 05 Apr 2013 13:57
The Anti-Social Behaviour (ASB) Dashboard provides a visual indication of the number of recorded ASB incidents against the previous year-to-date and long-term average. ASB incidents are broken down into three categories: personal, nuisance and environmental. All seven districts of Leicestershire are...

Crime Reduction Dashboards (February 2013)
Fri, 05 Apr 2013 13:58
The Crime Reduction Dashboards provide a visual indication of recorded crime figures against performance/reduction targets for the year-to-date. All seven districts of Leicestershire are covered along with Leicester City, and an overall view of Leicestershire and the Force Area.
For more information,...
Crime Reduction Dashboards (March 2013)
Thu, 02 May 2013 14:21
The Crime Reduction Dashboards provide a visual indication of recorded crime figures against performance/reduction targets for the year-to-date. All seven districts of Leicestershire are covered along with Leicester City, and an overall view of Leicestershire and the Force Area.
For more information,...

Anti-Social Behaviour Dashboard (March 2013)
Thu, 02 May 2013 14:29
The Anti-Social Behaviour (ASB) Dashboard provides a visual indication of the number of recorded ASB incidents against the previous year-to-date and long-term average. ASB incidents are broken down into three categories: personal, nuisance and environmental. All seven districts of Leicestershire are...

Hate Incident Monitoring Project Dashboard: Quarter 4 – 2012/13
Thu, 02 May 2013 14:42
The Hate Incident Monitoring Project Dashboard provides a quarterly summary of the number of hate incidents reported to the Police, HIMP and in schools. Performance information is available for Leicestershire and each of the seven district Community Safety Partnerships. The reverse of the dashboard shows...

Anti-Social Behaviour Dashboard (April 2013)
Tue, 21 May 2013 12:20
The Anti-Social Behaviour (ASB) data is now available as a fully interactive dashboard in tableau available here.
(N.B. You will need Internet Explorer 8 or above, Google Chrome or latest Firefox to view the dashboard)
A PDF version can be downloaded below.
The ASB Dashboard compares the rolling year- to-date...

Oadby & Wigston Electoral Divisions - 2011 Census Key Stats
Wed, 29 May 2013 15:11
These reports provide a broad overview of the 2011 Census Key Statistics data, released by the Office for National Statistics on 30th January 2013, as part of the Census Second Release. The reports summarise a selection of key headline datasets of this release for Leicestershire Electoral Divisions (EDs)....

North West Leicestershire Electoral Divisions - 2011 Census Key Stats
Wed, 29 May 2013 15:17
These reports provide a broad overview of the 2011 Census Key Statistics data, released by the Office for National Statistics on 30th January 2013, as part of the Census Second Release. The reports summarise a selection of key headline datasets of this release for Leicestershire Electoral Divisions (EDs)....
Melton Electoral Divisions - 2011 Census Key Stats
Wed, 29 May 2013 15:18
These reports provide a broad overview of the 2011 Census Key Statistics data, released by the Office for National Statistics on 30th January 2013, as part of the Census Second Release. The reports summarise a selection of key headline datasets of this release for Leicestershire Electoral Divisions (EDs)....

Hinckley & Bosworth Electoral Divisions - 2011 Census Key Stats
Wed, 29 May 2013 15:18
These reports provide a broad overview of the 2011 Census Key Statistics data, released by the Office for National Statistics on 30th January 2013, as part of the Census Second Release. The reports summarise a selection of key headline datasets of this release for Leicestershire Electoral Divisions (EDs)....

Harborough Electoral Divisions - 2011 Census Key Stats
Wed, 29 May 2013 15:19
These reports provide a broad overview of the 2011 Census Key Statistics data, released by the Office for National Statistics on 30th January 2013, as part of the Census Second Release. The reports summarise a selection of key headline datasets of this release for Leicestershire Electoral Divisions (EDs)....

Charnwood Electoral Divisions - 2011 Census Key Stats
Wed, 29 May 2013 15:19
These reports provide a broad overview of the 2011 Census Key Statistics data, released by the Office for National Statistics on 30th January 2013, as part of the Census Second Release. The reports summarise a selection of key headline datasets of this release for Leicestershire Electoral Divisions (EDs)....
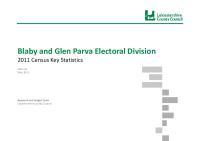
Blaby Electoral Divisions - 2011 Census Key Stats
Wed, 29 May 2013 15:19
These reports provide a broad overview of the 2011 Census Key Statistics data, released by the Office for National Statistics on 30th January 2013, as part of the Census Second Release. The reports summarise a selection of key headline datasets of this release for Leicestershire Electoral Divisions (EDs)....

Crime Reduction Dashboards (April 2013)
Fri, 31 May 2013 13:08
The Crime Reduction Dashboards provide a visual indication of recorded crime figures against performance/reduction targets for the year-to-date. All seven districts of Leicestershire are covered along with Leicester City, and an overall view of Leicestershire and the Force Area.
For more information,...

Safer Rutland Partnership Strategic Assessment – October 2011 - September 2012
Thu, 13 Jun 2013 12:14
The Partnership Strategic Assessment for Rutland brings together information regarding crime, disorder and community safety issues from across partner agencies to identify the longer-term issues impacting within Rutland County as well as the scope of, and projections for crime, criminality and other...