Displaying 1 to 13 of 13

Unemployment Bulletin November 2013
Wed, 18 Dec 2013
The monthly unemployment bulletin contains a range of unemployment related statistics, covering Leicester, Leicestershire and Rutland. The JSA claimant data in this bulletin is available down to ward level. The JSA data is also available broken down by the detailed ethnic groups down to Local Authority...

2011 Census - Diversity and Ethnic and Religious Mixing
Thu, 28 Nov 2013 10:19
The two briefings below use data from the 1991, 2001 and 2011 Censuses to explore diversity and ethnic and religious mixing in Leicester and Leicestershire.
Key findings include:
- The ethnic minority population, as measured by non-white residents, increased between 1991 and 2011 by 34,000 in Leicestershire...
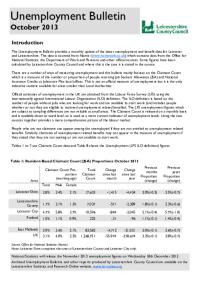
Unemployment Bulletin October 2013
Thu, 14 Nov 2013
The monthly unemployment bulletin contains a range of unemployment related statistics, covering Leicester, Leicestershire and Rutland. The JSA claimant data in this bulletin is available down to ward level. The JSA data is also available broken down by the detailed ethnic groups down to Local Authority...
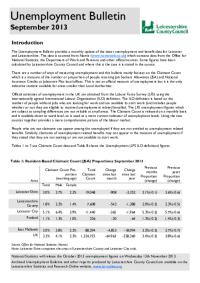
Unemployment Bulletin September 2013
Thu, 17 Oct 2013
The JSA claimant data in this bulletin is available down to ward level. The JSA data is also available broken down by the detailed ethnic groups down to Local Authority level.
The population figures used to calculate residence-based proportions (rates) have changed from working age (16-59f/64m) to aged...

Unemployment Bulletin August 2013
Wed, 11 Sep 2013
The JSA claimant data in this bulletin is available down to ward level. The JSA data is also available broken down by the detailed ethnic groups down to Local Authority level.
The population figures used to calculate residence-based proportions (rates) have changed from working age (16-59f/64m) to aged...
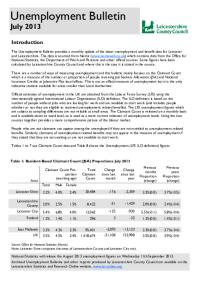
Unemployment Bulletin July 2013
Mon, 02 Sep 2013
The JSA claimant data in this bulletin is available down to ward level. The JSA data is also available broken down by the detailed ethnic groups down to Local Authority level.
The population figures used to calculate residence-based proportions (rates) have changed from working age (16-59f/64m) to aged...

Unemployment Bulletin June 2013
Wed, 17 Jul 2013
The JSA claimant data in this bulletin is available down to ward level. The JSA data is also available broken down by the detailed ethnic groups down to Local Authority level.
The population figures used to calculate residence-based proportions (rates) have changed from working age (16-59f/64m) to aged...

Unemployment Bulletin May 2013
Thu, 13 Jun 2013
The JSA claimant data in this bulletin is available down to ward level. The JSA data is also available broken down by the detailed ethnic groups down to Local Authority level.
The population figures used to calculate residence-based proportions (rates) have changed from working age (16-59f/64m) to aged...
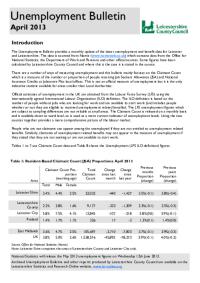
Unemployment Bulletin April 2013
Wed, 15 May 2013
The JSA claimant data in this bulletin is available down to ward level. The JSA data is also available broken down by the detailed ethnic groups down to Local Authority level.
The population figures used to calculate residence-based proportions (rates) have changed from working age (16-59f/64m) to aged...

Unemployment Bulletin March 2013
Thu, 18 Apr 2013
The JSA claimant data in this bulletin is available down to ward level. The JSA data is also available broken down by the detailed ethnic groups down to Local Authority level.
The population figures used to calculate residence-based proportions (rates) have changed from working age (16-59f/64m) to aged...

Unemployment Bulletin February 2013
Wed, 20 Mar 2013
The JSA claimant data in this bulletin is available down to ward level. The JSA data is also available broken down by the detailed ethnic groups down to Local Authority level.
The population figures used to calculate residence-based proportions (rates) have changed from working age (16-59f/64m) to aged...

Census 2011 - Open Atlas Project - Key Statistics information for districts
Tue, 12 Feb 2013 08:50
Alex Singleton, Lecturer in Geography at the University of Liverpool has mapped every Census Key Statistic at output area (OA) level for every local authority in England and Wales.
"Almost every non count variable (apart from Hectares) was mapped from the Key Statistics data disseminated by Nomis, and...

Unemployment Bulletin December 2012
Wed, 23 Jan 2013
The JSA claimant data in this bulletin is available down to ward level. The JSA data is also available broken down by the detailed ethnic groups down to Local Authority level.
The population figures used to calculate residence-based proportions (rates) have changed from working age (16-59f/64m) to aged...