Displaying 1 to 33 of 33

The Annual Performance Compendium contains service performance data including comparative performance. The dashboards focus on performance against the Council's priorities as set out in the Council Strategic Plan.

The Annual Delivery Report covers Leicestershire County Council's performance. It describes progress with implementing agreed plans and achievements over the last 12 months. It focuses on performance against County Council priorities as set out in the Council Strategic Plan and other main service strategies....

The following report provides a summary of a broad range of socioeconomic information for Leicestershire, covering the following topics:
- Population
- Economy
- Area Classifications
- Health
A brief commentary is included, along with links to further information. The report will be updated periodically as new data...

Leicestershire County Council had operated a joint Fostering, Adoption and Placements Service since April 2015. In July 2019 we separated the two functions to have our own dedicated Fostering and Adoption Services. Leicestershire County Council is responsible for a Local Authority Adoption Agency. It...

Leicestershire County Council Benchmarking Analysis 2019/20
Tue, 09 Mar 2021
Leicestershire County Council
Leicestershire County Council Benchmarking Analysis 2019/20
The Benchmarking Analysis 2019/20 compares performance outcomes in Leicestershire
with those of other local authority areas.

Environment and Transport Performance Report Q3 2020/21
Thu, 04 Mar 2021
Leicestershire County Council
Leicestershire County Council Environment and Transport Performance Report Q3 2020/21
The report and associated dashboard/s provide an update on the performance of Leicestershire County Council's Environment & Transport Department. The report covers: waste management; the Council's environmental impact...

Leicestershire County Council Adults & Communities Performance Report Q3 2020/21
The report and associated dashboard provide an update on the performance of Leicestershire County Council's Adults and Communities Department. The report covers adult social care services (including residential admissions,...

Alcohol‐Related Crime & The Night‐time Economy
Thu, 13 Dec 2012 11:59
This analysis has been developed as part of the work of the Leicestershire Reducing Alcohol Misuse Programme and identifies;
• the key night time economy alcohol crime hotspot areas across the County;
• a summary of the offender profiles based on police data;
• A summary of the offender profiles...

Unemployment Bulletin November 2012
Wed, 12 Dec 2012
The JSA claimant data in this bulletin is available down to ward level. The JSA data is also available broken down by the detailed ethnic groups down to Local Authority level.
The population figures used to calculate residence-based proportions (rates) have changed from working age (16-59f/64m) to aged...

Unemployment Bulletin October 2012
Wed, 14 Nov 2012
The JSA claimant data in this bulletin is available down to ward level. The JSA data is also available broken down by the detailed ethnic groups down to Local Authority level.
The population figures used to calculate residence-based proportions (rates) have changed from working age (16-59f/64m) to aged...

Crime Reduction Dashboards (September 2012)
Mon, 22 Oct 2012 09:45
The Crime Reduction Dashboards provide a visual indication of recorded crime figures against performance/reduction targets for the year-to-date. All seven districts of Leicestershire are covered along with Leicester City, and an overall view of Leicestershire and the Force Area.
For more information,...

Crime Reduction Dashboards (August 2012)
Mon, 22 Oct 2012 09:37
The Crime Reduction Dashboards provide a visual indication of recorded crime figures against performance/reduction targets for the year-to-date. All seven districts of Leicestershire are covered along with Leicester City, and an overall view of Leicestershire and the Force Area.
For more information,...
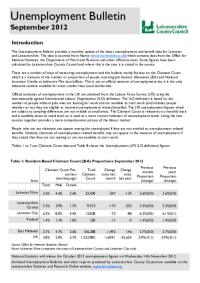
Unemployment Bulletin September 2012
Wed, 17 Oct 2012
The JSA claimant data in this bulletin is available down to ward level. The JSA data is also available broken down by the detailed ethnic groups down to Local Authority level.
The population figures used to calculate residence-based proportions (rates) have changed from working age (16-59f/64m) to aged...

Unemployment Bulletin August 2012
Wed, 12 Sep 2012
The JSA claimant data in this bulletin is available down to ward level. The JSA data is also available broken down by the detailed ethnic groups down to Local Authority level.
The population figures used to calculate residence-based proportions (rates) have changed from working age (16-59f/64m) to aged...

Crime Reduction Dashboards (July 2012)
Fri, 31 Aug 2012 11:45
The Crime Reduction Dashboards provide a visual indication of recorded crime figures against performance/reduction targets for the year-to-date. All seven districts of Leicestershire are covered along with Leicester City, and an overall view of Leicestershire and the Force Area.
For more information,...
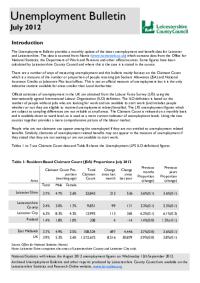
Unemployment Bulletin July 2012
Wed, 29 Aug 2012
The JSA claimant data in this bulletin is available down to ward level. The JSA data is also available broken down by the detailed ethnic groups down to Local Authority level.
The population figures used to calculate residence-based proportions (rates) have changed from working age (16-59f/64m) to aged...

Crime Reduction Dashboards (June 2012)
Mon, 30 Jul 2012 15:28
The Crime Reduction Dashboards provide a visual indication of recorded crime figures against performance/reduction targets for the year-to-date. All seven districts of Leicestershire are covered along with Leicester City, and an overall view of Leicestershire and the Force Area.
For more information,...

Unemployment Bulletin June 2012
Fri, 20 Jul 2012
The JSA claimant data in this bulletin is available down to ward level. The JSA data is also available broken down by the detailed ethnic groups down to Local Authority level.
The population figures used to calculate residence-based proportions (rates) have changed from working age (16-59f/64m) to aged...

Crime Reduction Dashboards (May 2012)
Fri, 22 Jun 2012 11:07
The Crime Reduction Dashboards provide a visual indication of recorded crime figures against performance/reduction targets for the year-to-date. All seven districts of Leicestershire are covered along with Leicester City, and an overall view of Leicestershire and the Force Area.
For more information,...

Unemployment Bulletin May 2012
Wed, 20 Jun 2012
The JSA claimant data in this bulletin is available down to ward level. The JSA data is also available broken down by the detailed ethnic groups down to Local Authority level.
The population figures used to calculate residence-based proportions (rates) have changed from working age (16-59f/64m) to aged...

Crime Reduction Dashboards (April 2012)
Mon, 11 Jun 2012 16:03
The Crime Reduction Dashboards provide a visual indication of recorded crime figures against performance/reduction targets for the year-to-date. All seven districts of Leicestershire are covered along with Leicester City, and an overall view of Leicestershire and the Force Area.
For more information,...

Unemployment Bulletin April 2012
Wed, 16 May 2012
The JSA claimant data in this bulletin is available down to ward level. The JSA data is also available broken down by the detailed ethnic groups down to Local Authority level.
The population figures used to calculate residence-based proportions (rates) have changed from working age (16-59f/64m) to aged...

Leicester and Leicestershire Business Survey - Winter 2012
Thu, 10 May 2012 14:08
The Leicester and Leicestershire Enterprise Partnership (LLEP) has published the latest edition of the Leicester and Leicestershire Business Survey. The business survey has been carried out by a partnership involving Leicestershire County Council, Leicester City Council and other key local agencies since...

Crime Reduction Dashboards (March 2012)
Thu, 03 May 2012 13:03
The Crime Reduction Dashboards provide a visual indication of recorded crime figures against performance/reduction targets for the year-to-date. All seven districts of Leicestershire are covered along with Leicester City, and an overall view of Leicestershire and the Force Area.
For more information,...

Leicestershire County Safer Communities Strategic Assessment - April 2012
Tue, 24 Apr 2012 14:13
The purpose of this document is to provide Leicestershire County Safer Communities Strategy Board (LSCSB) with a comprehensive picture of crime, anti-social behaviour and community safety issues across Leicestershire County. The report provides information on police recorded crime, anti-social behaviour...

Unemployment Bulletin March 2012
Wed, 18 Apr 2012
The JSA claimant data in this bulletin is available down to ward level. The JSA data is also available broken down by the detailed ethnic groups down to Local Authority level.
The population figures used to calculate residence-based proportions (rates) have changed from working age (16-59f/64m) to aged...

Crime Reduction Dashboards (February 2012)
Wed, 11 Apr 2012 09:10
The Crime Reduction Dashboards provide a visual indication of recorded crime figures against performance/reduction targets for the year-to-date. All seven districts of Leicestershire are covered along with Leicester City, and an overall view of Leicestershire and the Force Area.
For more information,...

Community Based Survey Results 2011/12 Q4
Wed, 04 Apr 2012 08:48
Leicestershire County Council and Leicestershire Police Authority have jointly commissioned the Community Based Survey, which replaces the previous community safety CRAVE Survey. The project combines key survey requirements of the County Council and Police Authority together into one consultation. As...

Unemployment Bulletin February 2012
Wed, 14 Mar 2012
The JSA claimant data in this bulletin is available down to ward level. The JSA data is also available broken down by the detailed ethnic groups down to Local Authority level.
The population figures used to calculate residence-based proportions (rates) have changed from working age (16-59f/64m) to aged...

Crime Reduction Dashboards (January 2012)
Fri, 24 Feb 2012 11:09
The Crime Reduction Dashboards provide a visual indication of recorded crime figures against performance/reduction targets for the year-to-date. All seven districts of Leicestershire are covered along with Leicester City, and an overall view of Leicestershire and the Force Area.
For more information,...
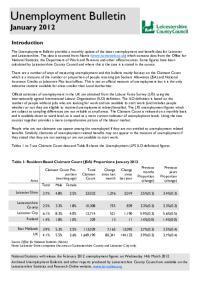
Unemployment Bulletin January 2012
Mon, 20 Feb 2012
The JSA claimant data in this bulletin is available down to ward level. The JSA data is also available broken down by the detailed ethnic groups down to Local Authority level.
The population figures used to calculate residence-based proportions (rates) have changed from working age (16-59f/64m) to aged...

Community Based Survey Results 2011/12 Q3
Mon, 13 Feb 2012 08:59
Leicestershire County Council and Leicestershire Police Authority have jointly commissioned the Community Based Survey, which replaces the previous community safety CRAVE Survey. The project combines key survey requirements of the County Council and Police Authority together into one consultation. As...

Unemployment Bulletin December 2011
Wed, 18 Jan 2012
The JSA claimant data in this bulletin is available down to ward level. The JSA data is also available broken down by the detailed ethnic groups down to Local Authority level.
The population figures used to calculate residence-based proportions (rates) have changed from working age (16-59f/64m) to aged...