Displaying 1 to 40 of 65

Anti-Social Behaviour Dashboard (March 2012)
Thu, 03 May 2012 13:28
The Anti-Social Behaviour (ASB) Dashboard provides a visual indication of the number of recorded ASB incidents against the previous year-to-date and long-term average. ASB incidents are broken down into three categories: personal, nuisance and environmental. All seven districts of Leicestershire are...

Unemployment Bulletin June 2012
Fri, 20 Jul 2012
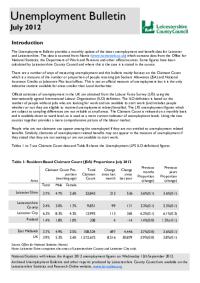
The JSA claimant data in this bulletin is available down to ward level. The JSA data is also available broken down by the detailed ethnic groups down to Local Authority level.
The population figures used to calculate residence-based proportions (rates) have changed from working age (16-59f/64m) to aged...
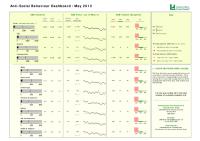
Anti-Social Behaviour Dashboard (May 2012)
Fri, 22 Jun 2012 13:34
The Anti-Social Behaviour (ASB) Dashboard provides a visual indication of the number of recorded ASB incidents against the previous year-to-date and long-term average. ASB incidents are broken down into three categories: personal, nuisance and environmental. All seven districts of Leicestershire are...

Crime Reduction Dashboards (May 2012)
Fri, 22 Jun 2012 11:07
The Crime Reduction Dashboards provide a visual indication of recorded crime figures against performance/reduction targets for the year-to-date. All seven districts of Leicestershire are covered along with Leicester City, and an overall view of Leicestershire and the Force Area.
For more information,...

Unemployment Bulletin May 2012
Wed, 20 Jun 2012
The JSA claimant data in this bulletin is available down to ward level. The JSA data is also available broken down by the detailed ethnic groups down to Local Authority level.
The population figures used to calculate residence-based proportions (rates) have changed from working age (16-59f/64m) to aged...

Anti-Social Behaviour Dashboard (April 2012)
Tue, 12 Jun 2012 12:56
The Anti-Social Behaviour (ASB) Dashboard provides a visual indication of the number of recorded ASB incidents against the previous year-to-date and long-term average. ASB incidents are broken down into three categories: personal, nuisance and environmental. All seven districts of Leicestershire are...

Crime Reduction Dashboards (April 2012)
Mon, 11 Jun 2012 16:03
The Crime Reduction Dashboards provide a visual indication of recorded crime figures against performance/reduction targets for the year-to-date. All seven districts of Leicestershire are covered along with Leicester City, and an overall view of Leicestershire and the Force Area.
For more information,...

Unemployment Bulletin April 2012
Wed, 16 May 2012
The JSA claimant data in this bulletin is available down to ward level. The JSA data is also available broken down by the detailed ethnic groups down to Local Authority level.
The population figures used to calculate residence-based proportions (rates) have changed from working age (16-59f/64m) to aged...

Domestic Abuse Dashboard: Quarter 4 2011/12
Thu, 03 May 2012 13:33
The Domestic Abuse Dashboard provides a visual indication of recorded offences and non-recordable incidents of domestic abuse reported to the Police in Leicestershire County for the current year-to-date compared to the same period last year. Figures are provided for all seven districts of Leicestershire....

Domestic Abuse Dashboard: Quarter 1 - 2012/13
Mon, 30 Jul 2012 15:17
The Domestic Abuse Dashboard provides a visual indication of recorded offences and non-recordable incidents of domestic abuse reported to the Police in Leicestershire County for the current year-to-date compared to the same period last year. Figures are provided for all seven districts of Leicestershire....

Crime Reduction Dashboards (March 2012)
Thu, 03 May 2012 13:03
The Crime Reduction Dashboards provide a visual indication of recorded crime figures against performance/reduction targets for the year-to-date. All seven districts of Leicestershire are covered along with Leicester City, and an overall view of Leicestershire and the Force Area.
For more information,...

Unemployment Bulletin March 2012
Wed, 18 Apr 2012
The JSA claimant data in this bulletin is available down to ward level. The JSA data is also available broken down by the detailed ethnic groups down to Local Authority level.
The population figures used to calculate residence-based proportions (rates) have changed from working age (16-59f/64m) to aged...

Anti-Social Behaviour Dashboard (February 2012)
Wed, 11 Apr 2012 09:34
The Anti-Social Behaviour (ASB) Dashboard provides a visual indication of the number of recorded ASB incidents against the previous year-to-date and long-term average. ASB incidents are broken down into three categories: personal, nuisance and environmental. All seven districts of Leicestershire are...

Crime Reduction Dashboards (February 2012)
Wed, 11 Apr 2012 09:10
The Crime Reduction Dashboards provide a visual indication of recorded crime figures against performance/reduction targets for the year-to-date. All seven districts of Leicestershire are covered along with Leicester City, and an overall view of Leicestershire and the Force Area.
For more information,...

Unemployment Bulletin February 2012
Wed, 14 Mar 2012
The JSA claimant data in this bulletin is available down to ward level. The JSA data is also available broken down by the detailed ethnic groups down to Local Authority level.
The population figures used to calculate residence-based proportions (rates) have changed from working age (16-59f/64m) to aged...

Safer North West Partnership Strategic Assessment 2011
Mon, 12 Mar 2012 15:51
The Partnership Strategic Assessment (PSA) is a statutory document produced annually to inform Community Safety Partnerships about crime, disorder and community safety issues in their area. The aim of this Strategic assessment is to provide Community Safety Partnerships with a comprehensive analysis...
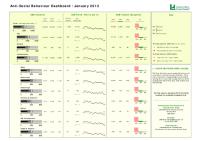
Anti-Social Behaviour Dashboard (January 2012)
Fri, 24 Feb 2012 11:34
The Anti-Social Behaviour (ASB) Dashboard provides a visual indication of the number of recorded ASB incidents against the previous year-to-date and long-term average. ASB incidents are broken down into three categories: personal, nuisance and environmental. All seven districts of Leicestershire are...

Crime Reduction Dashboards (January 2012)
Fri, 24 Feb 2012 11:09
The Crime Reduction Dashboards provide a visual indication of recorded crime figures against performance/reduction targets for the year-to-date. All seven districts of Leicestershire are covered along with Leicester City, and an overall view of Leicestershire and the Force Area.
For more information,...

Anti-Social Behaviour Dashboard (June 2012)
Mon, 30 Jul 2012 15:25
The Anti-Social Behaviour (ASB) Dashboard provides a visual indication of the number of recorded ASB incidents against the previous year-to-date and long-term average. ASB incidents are broken down into three categories: personal, nuisance and environmental. All seven districts of Leicestershire are...

Crime Reduction Dashboards (June 2012)
Mon, 30 Jul 2012 15:28
The Crime Reduction Dashboards provide a visual indication of recorded crime figures against performance/reduction targets for the year-to-date. All seven districts of Leicestershire are covered along with Leicester City, and an overall view of Leicestershire and the Force Area.
For more information,...

Local Tobacco Control Profiles
Tue, 28 Aug 2012 09:28
Summary of local tobacco control profiles for Leicestershire and Rutland
Unemployment Bulletin July 2012
Wed, 29 Aug 2012
The JSA claimant data in this bulletin is available down to ward level. The JSA data is also available broken down by the detailed ethnic groups down to Local Authority level.
The population figures used to calculate residence-based proportions (rates) have changed from working age (16-59f/64m) to aged...

Crime Reduction Dashboards (July 2012)
Fri, 31 Aug 2012 11:45
The Crime Reduction Dashboards provide a visual indication of recorded crime figures against performance/reduction targets for the year-to-date. All seven districts of Leicestershire are covered along with Leicester City, and an overall view of Leicestershire and the Force Area.
For more information,...

Anti-Social Behaviour Dashboard (July 2012)
Mon, 03 Sep 2012 12:27
The Anti-Social Behaviour (ASB) Dashboard provides a visual indication of the number of recorded ASB incidents against the previous year-to-date and long-term average. ASB incidents are broken down into three categories: personal, nuisance and environmental. All seven districts of Leicestershire are...

Unemployment Bulletin August 2012
Wed, 12 Sep 2012
The JSA claimant data in this bulletin is available down to ward level. The JSA data is also available broken down by the detailed ethnic groups down to Local Authority level.
The population figures used to calculate residence-based proportions (rates) have changed from working age (16-59f/64m) to aged...
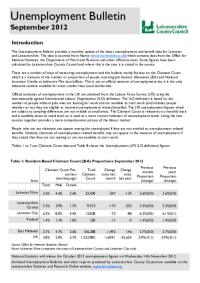
Unemployment Bulletin September 2012
Wed, 17 Oct 2012
The JSA claimant data in this bulletin is available down to ward level. The JSA data is also available broken down by the detailed ethnic groups down to Local Authority level.
The population figures used to calculate residence-based proportions (rates) have changed from working age (16-59f/64m) to aged...

Crime Reduction Dashboards (August 2012)
Mon, 22 Oct 2012 09:37
The Crime Reduction Dashboards provide a visual indication of recorded crime figures against performance/reduction targets for the year-to-date. All seven districts of Leicestershire are covered along with Leicester City, and an overall view of Leicestershire and the Force Area.
For more information,...

Crime Reduction Dashboards (September 2012)
Mon, 22 Oct 2012 09:45
The Crime Reduction Dashboards provide a visual indication of recorded crime figures against performance/reduction targets for the year-to-date. All seven districts of Leicestershire are covered along with Leicester City, and an overall view of Leicestershire and the Force Area.
For more information,...
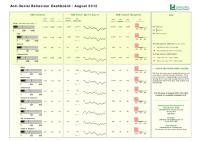
Anti-Social Behaviour Dashboard (Aug 2012)
Mon, 22 Oct 2012 09:51
The Anti-Social Behaviour (ASB) Dashboard provides a visual indication of the number of recorded ASB incidents against the previous year-to-date and long-term average. ASB incidents are broken down into three categories: personal, nuisance and environmental. All seven districts of Leicestershire are...

Anti-Social Behaviour Dashboard (September 2012)
Mon, 22 Oct 2012 09:53
The Anti-Social Behaviour (ASB) Dashboard provides a visual indication of the number of recorded ASB incidents against the previous year-to-date and long-term average. ASB incidents are broken down into three categories: personal, nuisance and environmental. All seven districts of Leicestershire are...

Domestic Abuse Dashboard Quarter 2 - 2012/13
Fri, 02 Nov 2012 12:46
The Domestic Abuse Dashboard provides a visual indication of recorded offences and non-recordable incidents of domestic abuse reported to the Police in Leicestershire County for the current year-to-date compared to the same period last year. Figures are provided for all seven districts of Leicestershire....

Unemployment Bulletin October 2012
Wed, 14 Nov 2012
The JSA claimant data in this bulletin is available down to ward level. The JSA data is also available broken down by the detailed ethnic groups down to Local Authority level.
The population figures used to calculate residence-based proportions (rates) have changed from working age (16-59f/64m) to aged...

Unemployment Bulletin November 2012
Wed, 12 Dec 2012
The JSA claimant data in this bulletin is available down to ward level. The JSA data is also available broken down by the detailed ethnic groups down to Local Authority level.
The population figures used to calculate residence-based proportions (rates) have changed from working age (16-59f/64m) to aged...

Unemployment Bulletin June 2009
Wed, 15 Jul 2009
The monthly Unemployment Bulletin provides data on number and rate of Job Seekers Allowance (JSA) claimants across Leicester Shire.
The JSA claimant data in this bulletin is available down to ward level. The JSA data is also available broken down by the detailed ethnic groups down to Local Authority level....

Credit Crunch Report January 2009
Fri, 23 Jan 2009
This January report analyses a range of up to date information to assess the local impact of the credit crunch in the context of the national economic downturn. The report uses local datasets such as claimant data, employment trends and house prices. Each month new data will be included to monitor the...

Unemployment Bulletin January 2009
Wed, 11 Feb 2009
The monthly Unemployment Bulletin provides data on number and rate of Job Seekers Allowance (JSA) claimants across Leicester Shire.
The JSA claimant data in this bulletin is available down to ward level. The JSA data is also available broken down by the detailed ethnic groups down to Local Authority level...

Social Capital Survey 2007
Wed, 11 Feb 2009 15:58
As part of the Stronger Communities Block of the Leicestershire Local Area Agreement (LAA), the Communities and Voluntary Sector (CVS), DeMontfort University and Leicestershire County Council conducted a survey that attempted to baseline levels of social capital in 20 areas across Leicestershire.
Social...

Credit Crunch Report February 2009
Fri, 20 Feb 2009
This February report analyses a range of up to date information to assess the local impact of the credit crunch in Leicester and Leicestershire within the context of the national economic downturn. This months report features local analysis of ;
Unemployment
-Comparisons with 1990's
-Geography, ethnicity...

Unemployment Bulletin February 2009
Wed, 18 Mar 2009
The monthly Unemployment Bulletin provides data on number and rate of Job Seekers Allowance (JSA) claimants across Leicester Shire.
The JSA claimant data in this bulletin is available down to ward level. The JSA data is also available broken down by the detailed ethnic groups down to Local Authority level...

Leicester and Leicestershire House Price and Sales Volume Monthly bulletin (October '09)
Mon, 28 Sep 2009 12:00
Using sales data, sourced from The Land Registry House Price Index (HPI), this report outlines house price and sales trends during a specified 12 month period. The HPI captures changes in the value of residential properties by analysing sales data collected on all residential housing transactions, whether...