Displaying 1 to 40 of 182

A&C Performance Report Q1 2017-18
Tue, 12 Sep 2017
Leicestershire County Council - Adults & Communities Performance Report Q1 2017-18.
The report and associated dashboard provide an update on the performance of Leicestershire County Council's Adults and Communities Department. The report covers adult social care services (including residential admissions,...

A&C Performance Report Q1 2017-18 Appendix A-B-C
Tue, 12 Sep 2017
Leicestershire County Council - Adults & Communities Performance Dashboards Q1 2017/18.
The dashboard and associated report provide an update on the performance of Leicestershire County Council's Adults and Communities Department. The dashboard covers adult social care services (including residential...

Anti-Social Behaviour Dashboard (Dec 2012)
Thu, 31 Jan 2013 10:21
The Anti-Social Behaviour (ASB) Dashboard provides a visual indication of the number of recorded ASB incidents against the previous year-to-date and long-term average. ASB incidents are broken down into three categories: personal, nuisance and environmental. All seven districts of Leicestershire are...

Anti-Social Behaviour Dashboard (February 2013)
Fri, 05 Apr 2013 13:57
The Anti-Social Behaviour (ASB) Dashboard provides a visual indication of the number of recorded ASB incidents against the previous year-to-date and long-term average. ASB incidents are broken down into three categories: personal, nuisance and environmental. All seven districts of Leicestershire are...

Anti-Social Behaviour Dashboard (January 2013)
Tue, 05 Mar 2013 14:18
The Anti-Social Behaviour (ASB) Dashboard provides a visual indication of the number of recorded ASB incidents against the previous year-to-date and long-term average. ASB incidents are broken down into three categories: personal, nuisance and environmental. All seven districts of Leicestershire are...

Anti-Social Behaviour Dashboard (March 2013)
Thu, 02 May 2013 14:29
The Anti-Social Behaviour (ASB) Dashboard provides a visual indication of the number of recorded ASB incidents against the previous year-to-date and long-term average. ASB incidents are broken down into three categories: personal, nuisance and environmental. All seven districts of Leicestershire are...

Anti-Social Behaviour Dashboard (Nov 2012)
Thu, 31 Jan 2013 10:14
The Anti-Social Behaviour (ASB) Dashboard provides a visual indication of the number of recorded ASB incidents against the previous year-to-date and long-term average. ASB incidents are broken down into three categories: personal, nuisance and environmental. All seven districts of Leicestershire are...

Anti-Social Behaviour Dashboard (Oct 2012)
Thu, 31 Jan 2013 10:12
The Anti-Social Behaviour (ASB) Dashboard provides a visual indication of the number of recorded ASB incidents against the previous year-to-date and long-term average. ASB incidents are broken down into three categories: personal, nuisance and environmental. All seven districts of Leicestershire are...

Black Enterprise Leicestershire 2009
Wed, 15 Apr 2009 09:31
African Caribbean Citizens Forum (ACCF) commissioned this report to research Black owned enterprises in selected towns across Leicestershire with a view to establishing a feel for their number, gender participation and survival rates. ACCF also wanted to understand the kinds of barriers to start-up faced...

Children & Families Performance Dashboards Q1 2017-18
Mon, 11 Sep 2017
Leicestershire County Council - Children & Families Performance Dashboards Q1 2017-18.
The dashboard and associated report provide an update on the performance of Leicestershire County Council's Children & Families Department. The dashboard covers children's social care services (including child...

Children & Families Performance Report Q1 2017-18
Mon, 11 Sep 2017
Leicestershire County Council - Children & Families Performance Report Q1 2017-18.
The report and associated dashboard provide an update on the performance of Leicestershire County Council's Children & Families Department. The report covers children's social care services (including child protection,...

Community Based Survey Results 2012/13 Q3
Fri, 01 Feb 2013 14:17
Leicestershire County Council and Leicestershire Police Authority have jointly commissioned the Community Based Survey, which replaces the previous community safety CRAVE Survey. The project combines key survey requirements of the County Council and Police Authority together into one consultation. As...

Leicestershire County Council and Leicestershire Police have jointly commissioned the Community Based Survey, which replaces the previous community safety CRAVE Survey. The project combines key survey requirements of the County Council and Police together into one consultation. As a result, the Community...

Leicestershire County Council and Leicestershire Police have jointly commissioned the Community Based Survey, which replaces the previous community safety CRAVE Survey. The project combines key survey requirements of the County Council and Police together into one consultation. As a result, the Community...
Leicestershire County Council and Leicestershire Police have jointly commissioned the Community Based Survey, which replaces the previous community safety CRAVE Survey. The project combines key survey requirements of the County Council and Police together into one consultation. As a result, the Community...
Leicestershire County Council and Leicestershire Police have jointly commissioned the Community Based Survey, which replaces the previous community safety CRAVE Survey. The project combines key survey requirements of the County Council and Police together into one consultation. As a result, the Community...
Leicestershire County Council and Leicestershire Police have jointly commissioned a Community Based Survey. The survey combines key survey requirements of the County Council and Police together into one consultation. As a result, the Community Based Survey has a broad range of questions, covering perceptions...
Credit Crunch Report April 2009
Mon, 27 Apr 2009
This April report analyses a range of up to date information to assess the local impact of the credit crunch in Leicester and Leicestershire within the context of the national economic downturn. This month's report features newly developed dashboards to compare change over time on claimant, vacancy and...

Credit Crunch Report December 2008
Fri, 19 Dec 2008
This report, to be produced monthly, uses a range of information to assess the local impact of the credit crunch in the context of the national economic downturn. The report uses local datasets such as claimant data, housing sales and business optimism. Each month new data will be included to monitor...

Credit Crunch Report February 2009
Fri, 20 Feb 2009
This February report analyses a range of up to date information to assess the local impact of the credit crunch in Leicester and Leicestershire within the context of the national economic downturn. This months report features local analysis of ;
Unemployment
-Comparisons with 1990's
-Geography, ethnicity...

Credit Crunch Report January 2009
Fri, 23 Jan 2009
This January report analyses a range of up to date information to assess the local impact of the credit crunch in the context of the national economic downturn. The report uses local datasets such as claimant data, employment trends and house prices. Each month new data will be included to monitor the...

Credit Crunch Report June 2009
Mon, 22 Jun 2009
This June report analyses a range of up to date information to assess the local impact of the credit crunch in Leicester and Leicestershire within the context of the national economic downturn. This month's report features newly developed dashboards to compare change over time on claimant, vacancy and...

Credit Crunch Report March 2009
Tue, 24 Mar 2009
This March report analyses a range of up to date information to assess the local impact of the credit crunch in Leicester and Leicestershire within the context of the national economic downturn. This months report features local analysis of ;
JSA Claimants
NEET
Tacking worklessness
Vacancies
Vulnerability...

Credit Crunch Report May 2009
Tue, 19 May 2009
This May report analyses a range of up to date information to assess the local impact of the credit crunch in Leicester and Leicestershire within the context of the national economic downturn. This month's report features newly developed dashboards to compare change over time on claimant, vacancy and...
Credit Crunch Report September 2009
Wed, 07 Oct 2009
This September report analyses a range of up to date information, research and reports to assess the local impact of the credit crunch in Leicester and Leicestershire within the context of the national economic downturn. This report features in depth local analysis of ;
• Job Prospects
• Young...

Crime Reduction Dashboards (April 2012)
Mon, 11 Jun 2012 16:03
The Crime Reduction Dashboards provide a visual indication of recorded crime figures against performance/reduction targets for the year-to-date. All seven districts of Leicestershire are covered along with Leicester City, and an overall view of Leicestershire and the Force Area.
For more information,...

Crime Reduction Dashboards (April 2013)
Fri, 31 May 2013 13:08
The Crime Reduction Dashboards provide a visual indication of recorded crime figures against performance/reduction targets for the year-to-date. All seven districts of Leicestershire are covered along with Leicester City, and an overall view of Leicestershire and the Force Area.
For more information,...

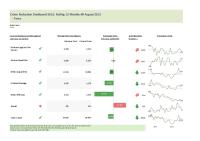
Crime Reduction Dashboards (August 2012)
Mon, 22 Oct 2012 09:37
The Crime Reduction Dashboards provide a visual indication of recorded crime figures against performance/reduction targets for the year-to-date. All seven districts of Leicestershire are covered along with Leicester City, and an overall view of Leicestershire and the Force Area.
For more information,...
Crime Reduction Dashboards (August 2013)
Mon, 16 Sep 2013 15:09
The Crime Reduction data is available as a fully interactive dashboard in tableau available here.
(N.B. You will need Internet Explorer 8 or above, Google Chrome or latest Firefox to view the dashboard)
A PDF version can be downloaded below.
The Crime Reduction Dashboards provide a visual indication of...

Crime Reduction Dashboards (December 2012)
Thu, 31 Jan 2013 10:25
The Crime Reduction Dashboards provide a visual indication of recorded crime figures against performance/reduction targets for the year-to-date. All seven districts of Leicestershire are covered along with Leicester City, and an overall view of Leicestershire and the Force Area.
For more information,...

Crime Reduction Dashboards (December 2013)
Mon, 20 Jan 2014 12:23
The Crime Reduction data is available as a fully interactive dashboard in tableau available here.
(N.B. You will need Internet Explorer 8 or above, Google Chrome or latest Firefox to view the dashboard)
A PDF version can be downloaded below.
The Crime Reduction Dashboards provide a visual indication of...

Crime Reduction Dashboards (February 2012)
Wed, 11 Apr 2012 09:10
The Crime Reduction Dashboards provide a visual indication of recorded crime figures against performance/reduction targets for the year-to-date. All seven districts of Leicestershire are covered along with Leicester City, and an overall view of Leicestershire and the Force Area.
For more information,...

Crime Reduction Dashboards (February 2013)
Fri, 05 Apr 2013 13:58
The Crime Reduction Dashboards provide a visual indication of recorded crime figures against performance/reduction targets for the year-to-date. All seven districts of Leicestershire are covered along with Leicester City, and an overall view of Leicestershire and the Force Area.
For more information,...

Crime Reduction Dashboards (February 2014)
Thu, 13 Mar 2014 15:30
The Crime Reduction data is available as a fully interactive dashboard in tableau available here.
(N.B. You will need Internet Explorer 8 or above, Google Chrome or latest Firefox to view the dashboard)
A PDF version can be downloaded below.
The Crime Reduction Dashboards provide a visual indication of...

Crime Reduction Dashboards (January 2012)
Fri, 24 Feb 2012 11:09
The Crime Reduction Dashboards provide a visual indication of recorded crime figures against performance/reduction targets for the year-to-date. All seven districts of Leicestershire are covered along with Leicester City, and an overall view of Leicestershire and the Force Area.
For more information,...

Crime Reduction Dashboards (January 2013)
Tue, 05 Mar 2013 14:16
The Crime Reduction Dashboards provide a visual indication of recorded crime figures against performance/reduction targets for the year-to-date. All seven districts of Leicestershire are covered along with Leicester City, and an overall view of Leicestershire and the Force Area.
For more information,...

Crime Reduction Dashboards (January 2014)
Mon, 10 Feb 2014 15:55
The Crime Reduction data is available as a fully interactive dashboard in tableau available here.
(N.B. You will need Internet Explorer 8 or above, Google Chrome or latest Firefox to view the dashboard)
A PDF version can be downloaded below.
The Crime Reduction Dashboards provide a visual indication of...

Crime Reduction Dashboards (July 2012)
Fri, 31 Aug 2012 11:45
The Crime Reduction Dashboards provide a visual indication of recorded crime figures against performance/reduction targets for the year-to-date. All seven districts of Leicestershire are covered along with Leicester City, and an overall view of Leicestershire and the Force Area.
For more information,...

Crime Reduction Dashboards (July 2013)
Thu, 29 Aug 2013 10:55
The Crime Reduction Dashboards provide a visual indication of recorded crime figures against performance/reduction targets for the year-to-date. All seven districts of Leicestershire are covered along with Leicester City, and an overall view of Leicestershire and the Force Area. (Tableau dashboards to...

Crime Reduction Dashboards (June 2012)
Mon, 30 Jul 2012 15:28
The Crime Reduction Dashboards provide a visual indication of recorded crime figures against performance/reduction targets for the year-to-date. All seven districts of Leicestershire are covered along with Leicester City, and an overall view of Leicestershire and the Force Area.
For more information,...