Displaying 1 to 40 of 71
Active People KPI1 small area estimates for Blaby
Mon, 10 Dec 2007 14:24
The Active People Survey is the largest ever survey of sport and active recreation to be undertaken by Sport England in Europe. Key Performance Indicator (KPI) #1 is the numbers of people participating moderately in physical activity for thirty minutes three times a week. This thematic map of Blaby district...

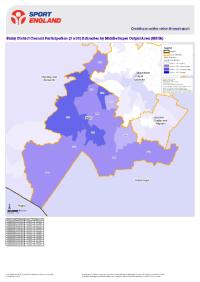
Active People KPI1 small area estimates for Charnwood
Mon, 10 Dec 2007 14:22
The Active People Survey is the largest ever survey of sport and active recreation to be undertaken by Sport England in Europe. Key Performance Indicator (KPI) #1 is the numbers of people participating moderately in physical activity for thirty minutes three times a week. This thematic map of the Charnwood...

Active People KPI1 small area estimates for Harborough
Mon, 10 Dec 2007 14:21
The Active People Survey is the largest ever survey of sport and active recreation to be undertaken by Sport England in Europe. Key Performance Indicator (KPI) #1 is the numbers of people participating moderately in physical activity for thirty minutes three times a week. This thematic map of the Harborough...

Active People KPI1 small area estimates for Hinckley and Bosworth
Mon, 10 Dec 2007 14:19
The Active People Survey is the largest ever survey of sport and active recreation to be undertaken by Sport England in Europe. Key Performance Indicator (KPI) #1 is the numbers of people participating moderately in physical activity for thirty minutes three times a week. This thematic map of Hinckley...

Active People KPI1 small area estimates for Leicester
Mon, 10 Dec 2007 14:14
The Active People Survey is the largest ever survey of sport and active recreation to be undertaken by Sport England in Europe. Key Performance Indicator (KPI) #1 is the numbers of people participating moderately in physical activity for thirty minutes three times a week. This thematic map of Leicester...

Active People KPI1 small area estimates for Melton
Mon, 10 Dec 2007 14:20
The Active People Survey is the largest ever survey of sport and active recreation to be undertaken by Sport England in Europe. Key Performance Indicator (KPI) #1 is the numbers of people participating moderately in physical activity for thirty minutes three times a week. This thematic map of the Melton...

Active People KPI1 small area estimates for North West Leicestershire
Mon, 10 Dec 2007 14:23
The Active People Survey is the largest ever survey of sport and active recreation to be undertaken by Sport England in Europe. Key Performance Indicator (KPI) #1 is the numbers of people participating moderately in physical activity for thirty minutes three times a week. This thematic map of North West...

Active People KPI1 small area estimates for Oadby and Wigston
Mon, 10 Dec 2007 14:22
The Active People Survey is the largest ever survey of sport and active recreation to be undertaken by Sport England in Europe. Key Performance Indicator (KPI) #1 is the numbers of people participating moderately in physical activity for thirty minutes three times a week. This thematic map of Oadby and...

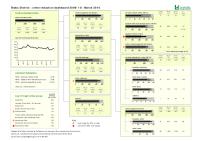
Anti-Social Behaviour Dashboard (August 2010)
Mon, 11 Oct 2010 07:36
The Anti-Social Behaviour (ASB) Dashboard provides a visual indication of the number of recorded ASB incidents against the previous year-to-date targets and long-term average. ASB incidents are broken down by category: Rowdy or Inconsiderate Behaviour, Vehicle Nuisance and Inappropriate Behaviour, Hoax...

Anti-Social Behaviour Dashboard (July 2010)
Fri, 20 Aug 2010 13:53
The Anti-Social Behaviour (ASB) Dashboard provides a visual indication of the number of recorded ASB incidents against the previous year-to-date targets and long-term average. ASB incidents are broken down by category: Rowdy or Inconsiderate Behaviour, Vehicle Nuisance and Inappropriate Behaviour, Hoax...
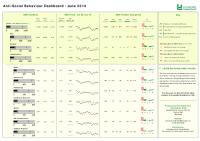
Anti-Social Behaviour Dashboard (June 2010)
Tue, 20 Jul 2010 15:19
The Anti-Social Behaviour (ASB) Dashboard provides a visual indication of the number of recorded ASB incidents against the previous year-to-date targets and long-term average. ASB incidents are broken down by category: Rowdy or Inconsiderate Behaviour, Vehicle Nuisance and Inappropriate Behaviour, Hoax...

Anti-Social Behaviour Dashboard (May 2010)
Wed, 30 Jun 2010 13:32
The Anti-Social Behaviour (ASB) Dashboard provides a visual indication of the number of recorded ASB incidents against the previous year-to-date targets and long-term average. ASB incidents are broken down by category: Rowdy or Inconsiderate Behaviour, Vehicle Nuisance and Inappropriate Behaviour, Hoax...

Anti-Social Behaviour Dashboard (October 2010)
Thu, 18 Nov 2010 14:20
The Anti-Social Behaviour (ASB) Dashboard provides a visual indication of the number of recorded ASB incidents against the previous year-to-date targets and long-term average. ASB incidents are broken down by category: Rowdy or Inconsiderate Behaviour, Vehicle Nuisance and Inappropriate Behaviour, Hoax...

Anti-Social Behaviour Dashboard (September 2010)
Wed, 20 Oct 2010 14:01
The Anti-Social Behaviour (ASB) Dashboard provides a visual indication of the number of recorded ASB incidents against the previous year-to-date targets and long-term average. ASB incidents are broken down by category: Rowdy or Inconsiderate Behaviour, Vehicle Nuisance and Inappropriate Behaviour, Hoax...

Anti-Social Behaviour Dashboard (Year End 2009/10)
Thu, 15 Apr 2010 17:11
The Anti-Social Behaviour (ASB) Dashboard provides a visual indication of the number of recorded ASB incidents against the previous year-to-date targets and long-term average. ASB incidents are broken down by category: Rowdy or Inconsiderate Behaviour, Vehicle Nuisance and Inappropriate Behaviour, Hoax...

Charnwood Priority Neighbourhood Profile: Loughborough East
Mon, 17 Sep 2007 07:27
The Charnwood Priority Neighbourhood Profile for Loughborough East is now available...
The Charnwood Priority Neighbourhood Profile for Loughborough East is now available. This profile provides a comprehensive overview of the Loughborough East priority neighbourhood. The report covers a range of useful...

Charnwood Priority Neighbourhood Profile: Loughborough West
Fri, 14 Dec 2007 16:08
The Charnwood Priority Neighbourhood Profile for Loughborough West is now available. This profile provides a comprehensive overview of the Loughborough West intervention and monitoring areas. The report covers a range of useful baseline statistics for the area including information on demographics, deprivation,...

Charnwood Priority Neighbourhood Profile: Mountsorrel
Fri, 14 Dec 2007 15:52
The Charnwood Priority Neighbourhood Profile for Mountsorrel is now available. This profile provides a comprehensive overview of the Mountsorrel intervention and monitoring areas. The report covers a range of useful baseline statistics for the area including information on demographics, deprivation,...
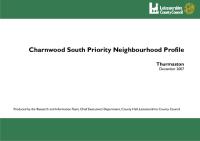
Charnwood Priority Neighbourhood Profile: Thurmaston
Fri, 14 Dec 2007 16:13
The Charnwood Priority Neighbourhood Profile for Thurmaston is now available. This profile provides a comprehensive overview of the Thurmaston intervention and monitoring areas. The report covers a range of useful baseline statistics for the area including information on demographics, deprivation, crime,...

Cohesive Communities in Leicestershire
Mon, 30 Jul 2007 08:16
This report was produced by the Research and Information Team at Leicestershire County Council and provides an overview and analysis of the issues around community cohesion in Leicestershire.
The report will contribute towards the evidence base for a Sustainable Community Strategy and will also along...

Crime Reduction Dashboards (August 2010)
Mon, 11 Oct 2010 07:37
The Crime Reduction Dashboards provide a visual indication of recorded crime figures against performance/reduction targets for the year-to-date. All seven districts of Leicestershire are covered along with Leicester City, and an overall view of Leicestershire and the Force Area. The local reduction targets...

Crime Reduction Dashboards (July 2010)
Fri, 20 Aug 2010 13:45
The Crime Reduction Dashboards provide a visual indication of recorded crime figures against performance/reduction targets for the year-to-date. All seven districts of Leicestershire are covered along with Leicester City, and an overall view of Leicestershire and the Force Area. The local reduction targets...
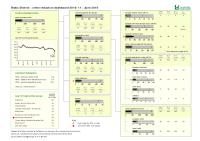
Crime Reduction Dashboards (June 2010)
Tue, 20 Jul 2010 15:14
The Crime Reduction Dashboards provide a visual indication of recorded crime figures against performance/reduction targets for the year-to-date. All seven districts of Leicestershire are covered along with Leicester City, and an overall view of Leicestershire and the Force Area. The local reduction targets...

Crime Reduction Dashboards (May 2010)
Wed, 30 Jun 2010 13:25
The Crime Reduction Dashboards provide a visual indication of recorded crime figures against performance/reduction targets for the year-to-date. All seven districts of Leicestershire are covered along with Leicester City, and an overall view of Leicestershire and the Force Area. The local reduction targets...

Crime Reduction Dashboards (October 2010)
Thu, 18 Nov 2010 14:13
The Crime Reduction Dashboards provide a visual indication of recorded crime figures against performance/reduction targets for the year-to-date. All seven districts of Leicestershire are covered along with Leicester City, and an overall view of Leicestershire and the Force Area. The local reduction targets...

Crime Reduction Dashboards (September 2010)
Wed, 20 Oct 2010 14:02
The Crime Reduction Dashboards provide a visual indication of recorded crime figures against performance/reduction targets for the year-to-date. All seven districts of Leicestershire are covered along with Leicester City, and an overall view of Leicestershire and the Force Area. The local reduction targets...
Crime Reduction Dashboards (Year End 2009/10)
Thu, 15 Apr 2010 17:13
The Crime Reduction Dashboards provide a visual indication of recorded crime figures against performance/reduction targets for the year-to-date. All seven districts of Leicestershire are covered along with Leicester City, and an overall view of Leicestershire and the Force Area. The local reduction targets...

Hinckley and Bosworth Neighbourhood Profile: Barwell
Mon, 02 Jul 2007 09:19
The Hinckley and Bosworth Priority Neighbourhood Profile for Barwell is now available...
The Hinckley and Bosworth Priority Neighbourhood Profile for Barwell is now available. This profile provides a comprehensive overview of the Barwell intervention and monitoring areas. The report covers a range of...

Hinckley and Bosworth Neighbourhood Profile: Earl Shilton
Mon, 02 Jul 2007 08:48
The Earl Shilton Neighbourhood Profile is now available...
The Hinckley and Bosworth Priority Neighbourhood Profile for Earl Shilton is now available. This profile provides a comprehensive overview of the Earl Shilton intervention and monitoring areas. The report covers a range of useful baseline statistics...
Hinckley and Bosworth Neighbourhood Profile: Hinckley Trinity West (Zone 1)
Tue, 18 Dec 2007 11:43
Description: The Hinckley and Bosworth Priority Neighbourhood Profile for Hinckley Trinity West (Hinckley Zone 1) is now available. This profile provides a comprehensive overview of the Hinckley Trinity West intervention and monitoring areas. The report covers a range of useful baseline statistics for...

Hinckley and Bosworth Neighbourhood Profile: Hinckley Westfield Junior School (Hinckley Zone 2)
Tue, 18 Dec 2007 10:17
The Hinckley and Bosworth Priority Neighbourhood Profile for Hinckley Westfield Junior School (Hinckley Zone 2) is now available. This profile provides a comprehensive overview of the Hinckley Westfield Junior School intervention and monitoring areas. The report covers a range of useful baseline statistics...

Housing Needs and Aspirations of Older People in Leicester and Leicestershire
Thu, 29 Jul 2010 14:35
This qualitative assessment research covers future housing needs and aspirations of older people from across the County and City of Leicester to inform the development of strategic services for this section of the population.
This work was commissioned by local authorites of the Leicester and Leicestershire...

Indices of Deprivation 2004 - Key Findings
Thu, 01 Nov 2007
The Indices of Deprivation 2004 are produced by the Office of the Deputy Prime Minister (ODPM). They are an attempt to measure deprivation in a consistent way for small areas across England. The following documents cover the individual districts of Leicestershire and Leicestershire county as a whole....

Leicester and Leicestershire Business Survey 2009/2010
Mon, 19 Apr 2010 10:08
The Leicester and Leicestershire Business Survey has been carried out by a partnership involving Leicestershire County Council, Leicester City Council and other key local agencies over the last 10 years. The survey provides a comprehensive picture of local business optimism and performance. Interviews...

Leicester and Leicestershire Economic Assessment
Fri, 28 May 2010 17:20
Economic Assessment (EA)
Background
The Local Democracy, Economic Development and Construction Act 2009 placed a duty on county councils and unitary district councils to prepare an economic assessment of the economic conditions of their area. This new duty came into force on 1st April 2010, at which point...

Leicester Shire Business Survey 2006/07
Tue, 15 May 2007 12:13
Leicester Shire Intelligence has published the latest edition of the Leicester Shire Business Survey. The survey provides a comprehensive picture of local business confidence and performance in Winter 2006/07.
Leicester Shire Intelligence manages the Leicester Shire Business Survey on behalf of local...

Melton Priority Neighbourhood Profile: Egerton/Fairmead
Thu, 08 Feb 2007 14:28
The Melton Priority Neighbourhood Profile for Egerton/Fairmead is now available.
This profile provides a comprehensive overview of the Egerton/Fairmead priority neighbourhood. The report covers a range of useful baseline statistics for the area including information on demographics, deprivation, crime,...

Melton Priority Neighbourhood profile: South Melton (Zone 3)
Thu, 14 Jun 2007 13:05
The Melton Priority Neighbourhood Profile for Zone 3 (South Melton) is now available...
The Melton Priority Neighbourhood Profile for South Melton (Zone 3) is now available. This profile provides a comprehensive overview of the South Melton priority neighbourhood. The report covers a range of useful baseline...

Melton Priority Neighbourhood Profile: Town Centre Flats (Zone 2)
Thu, 24 May 2007 13:17
The Melton Priority Neighbourhood Profile for Zone 2 (Town Centre Flats) is now available...
The Melton Priority Neighbourhood Profile for Town Centre Flats (Zone 2) is now available. This profile provides a comprehensive overview of the Town Centre Flats priority neighbourhood. The report covers a range...

North West Leicestershire Neighbourhood Profile: Ashby
Mon, 17 Dec 2007 15:18
The North West Leicestershire Priority Neighbourhood Profile for Ashby is now available. This profile provides a comprehensive overview of the Ashby intervention and monitoring areas. The report covers a range of useful baseline statistics for the area including information on demographics, deprivation,...