Displaying 1 to 40 of 86
Active People KPI1 small area estimates for Blaby
Mon, 10 Dec 2007 14:24
The Active People Survey is the largest ever survey of sport and active recreation to be undertaken by Sport England in Europe. Key Performance Indicator (KPI) #1 is the numbers of people participating moderately in physical activity for thirty minutes three times a week. This thematic map of Blaby district...

Active People KPI1 small area estimates for Charnwood
Mon, 10 Dec 2007 14:22
The Active People Survey is the largest ever survey of sport and active recreation to be undertaken by Sport England in Europe. Key Performance Indicator (KPI) #1 is the numbers of people participating moderately in physical activity for thirty minutes three times a week. This thematic map of the Charnwood...

Active People KPI1 small area estimates for Harborough
Mon, 10 Dec 2007 14:21
The Active People Survey is the largest ever survey of sport and active recreation to be undertaken by Sport England in Europe. Key Performance Indicator (KPI) #1 is the numbers of people participating moderately in physical activity for thirty minutes three times a week. This thematic map of the Harborough...

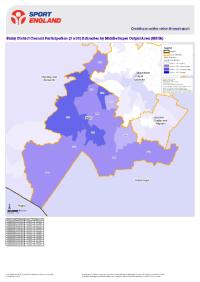
Active People KPI1 small area estimates for Hinckley and Bosworth
Mon, 10 Dec 2007 14:19
The Active People Survey is the largest ever survey of sport and active recreation to be undertaken by Sport England in Europe. Key Performance Indicator (KPI) #1 is the numbers of people participating moderately in physical activity for thirty minutes three times a week. This thematic map of Hinckley...

Active People KPI1 small area estimates for Leicester
Mon, 10 Dec 2007 14:14
The Active People Survey is the largest ever survey of sport and active recreation to be undertaken by Sport England in Europe. Key Performance Indicator (KPI) #1 is the numbers of people participating moderately in physical activity for thirty minutes three times a week. This thematic map of Leicester...

Active People KPI1 small area estimates for Melton
Mon, 10 Dec 2007 14:20
The Active People Survey is the largest ever survey of sport and active recreation to be undertaken by Sport England in Europe. Key Performance Indicator (KPI) #1 is the numbers of people participating moderately in physical activity for thirty minutes three times a week. This thematic map of the Melton...

Active People KPI1 small area estimates for North West Leicestershire
Mon, 10 Dec 2007 14:23
The Active People Survey is the largest ever survey of sport and active recreation to be undertaken by Sport England in Europe. Key Performance Indicator (KPI) #1 is the numbers of people participating moderately in physical activity for thirty minutes three times a week. This thematic map of North West...

Active People KPI1 small area estimates for Oadby and Wigston
Mon, 10 Dec 2007 14:22
The Active People Survey is the largest ever survey of sport and active recreation to be undertaken by Sport England in Europe. Key Performance Indicator (KPI) #1 is the numbers of people participating moderately in physical activity for thirty minutes three times a week. This thematic map of Oadby and...

Anti-Social Behaviour Dashboard (December 2013)
Thu, 16 Jan 2014 14:59
The Anti-Social Behaviour (ASB) data is now available as a fully interactive dashboard in tableau available here.
(N.B. You will need Internet Explorer 8 or above, Google Chrome or latest Firefox to view the dashboard)
A PDF version can be downloaded below.
The ASB Dashboard compares the rolling year- to-date...

Anti-Social Behaviour Dashboard (February 2014)
Thu, 13 Mar 2014 15:12
The Anti-Social Behaviour (ASB) data is now available as a fully interactive dashboard in tableau available here.
(N.B. You will need Internet Explorer 8 or above, Google Chrome or latest Firefox to view the dashboard)
A PDF version can be downloaded below.
The ASB Dashboard compares the rolling year- to-date...

Anti-Social Behaviour Dashboard (January 2014)
Mon, 10 Feb 2014 15:46
The Anti-Social Behaviour (ASB) data is now available as a fully interactive dashboard in tableau available here.
(N.B. You will need Internet Explorer 8 or above, Google Chrome or latest Firefox to view the dashboard)
A PDF version can be downloaded below.
The ASB Dashboard compares the rolling year- to-date...

Anti-Social Behaviour Dashboard (March 2014)
Tue, 29 Apr 2014 14:23
The Anti-Social Behaviour (ASB) data is now available as a fully interactive dashboard in tableau available here. (N.B. You will need Internet Explorer 8 or above, Google Chrome or latest Firefox to view the dashboard).
A PDF version can be downloaded below.
The ASB Dashboard compares the rolling year-...

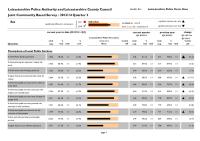
Blaby Community Safety Partnership Strategic Assessment – October 2012 - September 2013
Fri, 14 Feb 2014 10:48
The Partnership Strategic Assessment for Blaby District brings together information regarding crime, disorder and community safety issues from across partner agencies to identify the longer-term issues impacting within the district as well as the scope of, and projections for crime, criminality and other...

Charnwood Priority Neighbourhood Profile: Loughborough East
Mon, 17 Sep 2007 07:27
The Charnwood Priority Neighbourhood Profile for Loughborough East is now available...
The Charnwood Priority Neighbourhood Profile for Loughborough East is now available. This profile provides a comprehensive overview of the Loughborough East priority neighbourhood. The report covers a range of useful...

Charnwood Priority Neighbourhood Profile: Loughborough West
Fri, 14 Dec 2007 16:08
The Charnwood Priority Neighbourhood Profile for Loughborough West is now available. This profile provides a comprehensive overview of the Loughborough West intervention and monitoring areas. The report covers a range of useful baseline statistics for the area including information on demographics, deprivation,...

Charnwood Priority Neighbourhood Profile: Mountsorrel
Fri, 14 Dec 2007 15:52
The Charnwood Priority Neighbourhood Profile for Mountsorrel is now available. This profile provides a comprehensive overview of the Mountsorrel intervention and monitoring areas. The report covers a range of useful baseline statistics for the area including information on demographics, deprivation,...

Charnwood Priority Neighbourhood Profile: Thurmaston
Fri, 14 Dec 2007 16:13
The Charnwood Priority Neighbourhood Profile for Thurmaston is now available. This profile provides a comprehensive overview of the Thurmaston intervention and monitoring areas. The report covers a range of useful baseline statistics for the area including information on demographics, deprivation, crime,...

Children’s Social Care Needs Analysis : Understanding Service User Need using Cluster Analysis
Sat, 01 Nov 2014
Leicestershire County Council
In order to identify and understand the key service users groups for Children's Social Care Services in Leicestershire cluster analysis was undertaken using Children's Social Care Assessments data completed between 01/04/2014 and 17/09/2014 for the Children and Family Services department, Leicestershire...

Cohesive Communities in Leicestershire
Mon, 30 Jul 2007 08:16
This report was produced by the Research and Information Team at Leicestershire County Council and provides an overview and analysis of the issues around community cohesion in Leicestershire.
The report will contribute towards the evidence base for a Sustainable Community Strategy and will also along...

The Common Mental Health Disorders Dashboard, collated by Public Health England, collates and analyses a wide range of publically available data on prevalence, risk, prevention, early intervention, assessment, treatment, outcomes and service costs. It provides commissioners, service providers, clinicians,...
Community Based Survey Results 2013/14 Q3
Fri, 17 Jan 2014 14:37
Leicestershire County Council and Leicestershire Police Authority have jointly commissioned the Community Based Survey, which replaces the previous community safety CRAVE Survey.
The project combines key survey requirements of the County Council and Police Authority together into one consultation. As...

Leicestershire County Council and Leicestershire Police have jointly commissioned the Community Based Survey, which replaces the previous community safety CRAVE Survey. The project combines key survey requirements of the County Council and Police together into one consultation. As a result, the Community...
Leicestershire County Council and Leicestershire Police have jointly commissioned the Community Based Survey, which replaces the previous community safety CRAVE Survey. The project combines key survey requirements of the County Council and Police together into one consultation. As a result, the Community...
Leicestershire County Council and Leicestershire Police have jointly commissioned the Community Based Survey, which replaces the previous community safety CRAVE Survey. The project combines key survey requirements of the County Council and Police together into one consultation. As a result, the Community...

Crime Reduction Dashboards (December 2013)
Mon, 20 Jan 2014 12:23
The Crime Reduction data is available as a fully interactive dashboard in tableau available here.
(N.B. You will need Internet Explorer 8 or above, Google Chrome or latest Firefox to view the dashboard)
A PDF version can be downloaded below.
The Crime Reduction Dashboards provide a visual indication of...

Crime Reduction Dashboards (February 2014)
Thu, 13 Mar 2014 15:30
The Crime Reduction data is available as a fully interactive dashboard in tableau available here.
(N.B. You will need Internet Explorer 8 or above, Google Chrome or latest Firefox to view the dashboard)
A PDF version can be downloaded below.
The Crime Reduction Dashboards provide a visual indication of...

Crime Reduction Dashboards (January 2014)
Mon, 10 Feb 2014 15:55
The Crime Reduction data is available as a fully interactive dashboard in tableau available here.
(N.B. You will need Internet Explorer 8 or above, Google Chrome or latest Firefox to view the dashboard)
A PDF version can be downloaded below.
The Crime Reduction Dashboards provide a visual indication of...

Crime Reduction Dashboards (March 2014)
Wed, 30 Apr 2014 12:45
The Crime Reduction data is available as a fully interactive dashboard in tableau available here.
A PDF version can be downloaded below.
The Crime Reduction Dashboards provide a visual indication of recorded crime figures against performance/reduction targets for the year-to-date. All seven districts...

Director of Public Health Annual Report 2013
Mon, 03 Feb 2014
This is the last in a series of three reports from Leicestershire's Director of Public Health reviewing health across the life cycle. This report focuses on the health and wellbeing of working age adults. Earlier reports focussed on the health of children and the health of older people.
This report is...

This is the first report from Mike Sandys, Leicestershire's Director of Public Health, reviewing the infleunce of the wider determinents of health, such as good housing, good education, employment, social interactions and family support, on the health of the population.
In this report we take a structured...
Director of Public Health Annual Report 2014, Data Appendix
Mon, 24 Nov 2014
Leicestershire Public Health
All the data included in the annual report for 2014 is available in this data visualisation.
The tab across the top allows you to examine the "key facts", recommendations of the repot and data in each chapter. In each chapter tab, multiple indicators which relate to the chapter subject area can be examined...

Domestic Abuse Dashboard: Quarter 1 - 2014/15
Tue, 06 May 2014
Domestic Abuse data is now available as an interactive dashboard in tableau available here
A PDF version can be downloaded below.
The Domestic Abuse Dashboard provides a visual indication of recorded offences and non-recordable incidents of domestic abuse reported to the Police in Leicestershire County...

Domestic Abuse data is now available as an interactive dashboard.
A PDF version can be downloaded below.
The Domestic Abuse Dashboard provides a visual indication of recorded offences and non-recordable incidents of domestic abuse reported to the Police in Leicestershire County for the current year-to-date...

Domestic Abuse Dashboard: Quarter 3 - 2013/14
Tue, 21 Jan 2014 11:54
Domestic Abuse data is now available as an interactive dashboard in tableau available here.
A PDF version can be downloaded below.
The Domestic Abuse Dashboard provides a visual indication of recorded offences and non-recordable incidents of domestic abuse reported to the Police in Leicestershire County...

Domestic Abuse data is now available as an interactive dashboard in tableau [url=http://public.tableausoftware.com/views/DomesticAbuseDashboardQ4201314/HeadlineDashboard?amp;:showVizHome=no]available here[/url].
A PDF version can be downloaded below.
The Domestic Abuse Dashboard provides a visual indication...

Early Help Needs Analysis : Understanding Service User Need using Family Clusters
Sat, 01 Nov 2014
Leicestershire County Council
In order to identify and understand the key service users groups for Early Help services provided by the Children and Family Services department, Leicestershire County Council, Services in Leicestershire, cluster analysis was undertaken using data derived from Locality Panel Forms. Cluster analysis or...

Harborough Community Safety Partnership Strategic Assessment – October 2012 - September 2013
Mon, 03 Mar 2014 11:09
The Partnership Strategic Assessment for Harborough District brings together information regarding crime, disorder and community safety issues from across partner agencies to identify the longer-term issues impacting within the district as well as the scope of, and projections for crime, criminality...
The Hate Incident Monitoring Project (HIMP) data is now available as an interactive dashboard.
A PDF version can be downloaded below.
The Hate Incident Monitoring Project Dashboard provides a quarterly summary of the number of hate incidents reported to the Police and HIMP as well as maps showing hate...

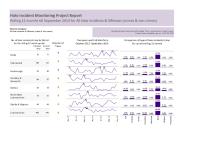
Hate Incident Monitoring Project Dashboard: Quarter3 – 2013/14
Tue, 21 Jan 2014 12:59
The Hate Incident Monitoring Project (HIMP) data is now available as a fully interactive dashboard in tableau available here.
A PDF version can be downloaded below.
The Hate Incident Monitoring Project Dashboard provides a quarterly summary of the number of hate incidents reported to the Police and HIMP...

Hate Incident Monitoring Project Dashboard: Quarter4 – 2013/14
Tue, 06 May 2014 16:24
The Hate Incident Monitoring Project (HIMP) data is now available as a fully interactive dashboard in tableau available here.
A PDF version can be downloaded below.
The Hate Incident Monitoring Project Dashboard provides a quarterly summary of the number of hate incidents reported to the Police and HIMP...