Displaying 1 to 40 of 84

Alcohol‐Related Crime & The Night‐time Economy
Thu, 13 Dec 2012 11:59
This analysis has been developed as part of the work of the Leicestershire Reducing Alcohol Misuse Programme and identifies;
• the key night time economy alcohol crime hotspot areas across the County;
• a summary of the offender profiles based on police data;
• A summary of the offender profiles...

Anti-Social Behaviour Dashboard (April 2012)
Tue, 12 Jun 2012 12:56
The Anti-Social Behaviour (ASB) Dashboard provides a visual indication of the number of recorded ASB incidents against the previous year-to-date and long-term average. ASB incidents are broken down into three categories: personal, nuisance and environmental. All seven districts of Leicestershire are...
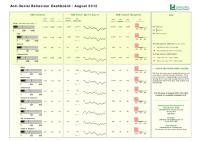
Anti-Social Behaviour Dashboard (Aug 2012)
Mon, 22 Oct 2012 09:51
The Anti-Social Behaviour (ASB) Dashboard provides a visual indication of the number of recorded ASB incidents against the previous year-to-date and long-term average. ASB incidents are broken down into three categories: personal, nuisance and environmental. All seven districts of Leicestershire are...

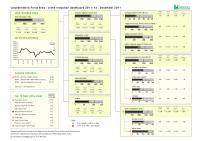
Anti-Social Behaviour Dashboard (December 2011)
Fri, 27 Jan 2012 09:47
The Anti-Social Behaviour (ASB) Dashboard provides a visual indication of the number of recorded ASB incidents against the previous year-to-date and long-term average. ASB incidents are broken down into three categories: personal, nuisance and environmental. All seven districts of Leicestershire are...

Anti-Social Behaviour Dashboard (February 2012)
Wed, 11 Apr 2012 09:34
The Anti-Social Behaviour (ASB) Dashboard provides a visual indication of the number of recorded ASB incidents against the previous year-to-date and long-term average. ASB incidents are broken down into three categories: personal, nuisance and environmental. All seven districts of Leicestershire are...
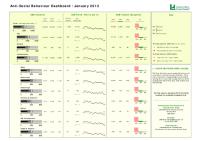
Anti-Social Behaviour Dashboard (January 2012)
Fri, 24 Feb 2012 11:34
The Anti-Social Behaviour (ASB) Dashboard provides a visual indication of the number of recorded ASB incidents against the previous year-to-date and long-term average. ASB incidents are broken down into three categories: personal, nuisance and environmental. All seven districts of Leicestershire are...

Anti-Social Behaviour Dashboard (July 2012)
Mon, 03 Sep 2012 12:27
The Anti-Social Behaviour (ASB) Dashboard provides a visual indication of the number of recorded ASB incidents against the previous year-to-date and long-term average. ASB incidents are broken down into three categories: personal, nuisance and environmental. All seven districts of Leicestershire are...

Anti-Social Behaviour Dashboard (June 2012)
Mon, 30 Jul 2012 15:25
The Anti-Social Behaviour (ASB) Dashboard provides a visual indication of the number of recorded ASB incidents against the previous year-to-date and long-term average. ASB incidents are broken down into three categories: personal, nuisance and environmental. All seven districts of Leicestershire are...

Anti-Social Behaviour Dashboard (March 2012)
Thu, 03 May 2012 13:28
The Anti-Social Behaviour (ASB) Dashboard provides a visual indication of the number of recorded ASB incidents against the previous year-to-date and long-term average. ASB incidents are broken down into three categories: personal, nuisance and environmental. All seven districts of Leicestershire are...
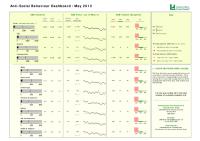
Anti-Social Behaviour Dashboard (May 2012)
Fri, 22 Jun 2012 13:34
The Anti-Social Behaviour (ASB) Dashboard provides a visual indication of the number of recorded ASB incidents against the previous year-to-date and long-term average. ASB incidents are broken down into three categories: personal, nuisance and environmental. All seven districts of Leicestershire are...
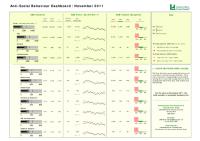
Anti-Social Behaviour Dashboard (November 2011)
Thu, 12 Jan 2012 09:27
The Anti-Social Behaviour (ASB) Dashboard provides a visual indication of the number of recorded ASB incidents against the previous year-to-date and long-term average. ASB incidents are broken down into three categories: personal, nuisance and environmental. All seven districts of Leicestershire are...

Anti-Social Behaviour Dashboard (September 2012)
Mon, 22 Oct 2012 09:53
The Anti-Social Behaviour (ASB) Dashboard provides a visual indication of the number of recorded ASB incidents against the previous year-to-date and long-term average. ASB incidents are broken down into three categories: personal, nuisance and environmental. All seven districts of Leicestershire are...

Blaby Community Safety Partnership Strategic Assessment 2011
Tue, 03 Apr 2012 12:12
The Partnership Strategic Assessment (PSA) is a statutory document produced annually to inform Community Safety Partnerships about crime, disorder and community safety issues in their area. The aim of this Strategic assessment is to provide Community Safety Partnerships with a comprehensive analysis...

Black Enterprise Leicestershire 2009
Wed, 15 Apr 2009 09:31
African Caribbean Citizens Forum (ACCF) commissioned this report to research Black owned enterprises in selected towns across Leicestershire with a view to establishing a feel for their number, gender participation and survival rates. ACCF also wanted to understand the kinds of barriers to start-up faced...

Census 2011 - First Release
Mon, 23 Jul 2012 13:01
On 16th July 2012 the Office of National Statistics published the first of four Census releases. This first release contains detail on:
• Sex and age (at 5 year bands) of the population
• Number of households
• Population estimates (residents and those living in communal establishments)...

Charnwood Community Safety Partnership Strategic Assessment 2011
Mon, 16 Apr 2012 11:50
The Partnership Strategic Assessment (PSA) is a statutory document produced annually to inform Community Safety Partnerships about crime, disorder and community safety issues in their area. The aim of this Strategic assessment is to provide Community Safety Partnerships with a comprehensive analysis...

Community Based Survey Results 2011/12 Q3
Mon, 13 Feb 2012 08:59
Leicestershire County Council and Leicestershire Police Authority have jointly commissioned the Community Based Survey, which replaces the previous community safety CRAVE Survey. The project combines key survey requirements of the County Council and Police Authority together into one consultation. As...

Community Based Survey Results 2011/12 Q4
Wed, 04 Apr 2012 08:48
Leicestershire County Council and Leicestershire Police Authority have jointly commissioned the Community Based Survey, which replaces the previous community safety CRAVE Survey. The project combines key survey requirements of the County Council and Police Authority together into one consultation. As...
Credit Crunch Report April 2009
Mon, 27 Apr 2009
This April report analyses a range of up to date information to assess the local impact of the credit crunch in Leicester and Leicestershire within the context of the national economic downturn. This month's report features newly developed dashboards to compare change over time on claimant, vacancy and...

Credit Crunch Report February 2009
Fri, 20 Feb 2009
This February report analyses a range of up to date information to assess the local impact of the credit crunch in Leicester and Leicestershire within the context of the national economic downturn. This months report features local analysis of ;
Unemployment
-Comparisons with 1990's
-Geography, ethnicity...

Credit Crunch Report January 2009
Fri, 23 Jan 2009
This January report analyses a range of up to date information to assess the local impact of the credit crunch in the context of the national economic downturn. The report uses local datasets such as claimant data, employment trends and house prices. Each month new data will be included to monitor the...

Credit Crunch Report June 2009
Mon, 22 Jun 2009
This June report analyses a range of up to date information to assess the local impact of the credit crunch in Leicester and Leicestershire within the context of the national economic downturn. This month's report features newly developed dashboards to compare change over time on claimant, vacancy and...

Credit Crunch Report March 2009
Tue, 24 Mar 2009
This March report analyses a range of up to date information to assess the local impact of the credit crunch in Leicester and Leicestershire within the context of the national economic downturn. This months report features local analysis of ;
JSA Claimants
NEET
Tacking worklessness
Vacancies
Vulnerability...

Credit Crunch Report May 2009
Tue, 19 May 2009
This May report analyses a range of up to date information to assess the local impact of the credit crunch in Leicester and Leicestershire within the context of the national economic downturn. This month's report features newly developed dashboards to compare change over time on claimant, vacancy and...
Credit Crunch Report September 2009
Wed, 07 Oct 2009
This September report analyses a range of up to date information, research and reports to assess the local impact of the credit crunch in Leicester and Leicestershire within the context of the national economic downturn. This report features in depth local analysis of ;
• Job Prospects
• Young...

Crime Reduction Dashboards (April 2012)
Mon, 11 Jun 2012 16:03
The Crime Reduction Dashboards provide a visual indication of recorded crime figures against performance/reduction targets for the year-to-date. All seven districts of Leicestershire are covered along with Leicester City, and an overall view of Leicestershire and the Force Area.
For more information,...

Crime Reduction Dashboards (August 2012)
Mon, 22 Oct 2012 09:37
The Crime Reduction Dashboards provide a visual indication of recorded crime figures against performance/reduction targets for the year-to-date. All seven districts of Leicestershire are covered along with Leicester City, and an overall view of Leicestershire and the Force Area.
For more information,...
Crime Reduction Dashboards (December 2011)
Fri, 27 Jan 2012 09:38
The Crime Reduction Dashboards provide a visual indication of recorded crime figures against performance/reduction targets for the year-to-date. All seven districts of Leicestershire are covered along with Leicester City, and an overall view of Leicestershire and the Force Area.
For more information,...

Crime Reduction Dashboards (February 2012)
Wed, 11 Apr 2012 09:10
The Crime Reduction Dashboards provide a visual indication of recorded crime figures against performance/reduction targets for the year-to-date. All seven districts of Leicestershire are covered along with Leicester City, and an overall view of Leicestershire and the Force Area.
For more information,...

Crime Reduction Dashboards (January 2012)
Fri, 24 Feb 2012 11:09
The Crime Reduction Dashboards provide a visual indication of recorded crime figures against performance/reduction targets for the year-to-date. All seven districts of Leicestershire are covered along with Leicester City, and an overall view of Leicestershire and the Force Area.
For more information,...

Crime Reduction Dashboards (July 2012)
Fri, 31 Aug 2012 11:45
The Crime Reduction Dashboards provide a visual indication of recorded crime figures against performance/reduction targets for the year-to-date. All seven districts of Leicestershire are covered along with Leicester City, and an overall view of Leicestershire and the Force Area.
For more information,...

Crime Reduction Dashboards (June 2012)
Mon, 30 Jul 2012 15:28
The Crime Reduction Dashboards provide a visual indication of recorded crime figures against performance/reduction targets for the year-to-date. All seven districts of Leicestershire are covered along with Leicester City, and an overall view of Leicestershire and the Force Area.
For more information,...

Crime Reduction Dashboards (March 2012)
Thu, 03 May 2012 13:03
The Crime Reduction Dashboards provide a visual indication of recorded crime figures against performance/reduction targets for the year-to-date. All seven districts of Leicestershire are covered along with Leicester City, and an overall view of Leicestershire and the Force Area.
For more information,...

Crime Reduction Dashboards (May 2012)
Fri, 22 Jun 2012 11:07
The Crime Reduction Dashboards provide a visual indication of recorded crime figures against performance/reduction targets for the year-to-date. All seven districts of Leicestershire are covered along with Leicester City, and an overall view of Leicestershire and the Force Area.
For more information,...

Crime Reduction Dashboards (November 2011)
Thu, 12 Jan 2012 09:06
The Crime Reduction Dashboards provide a visual indication of recorded crime figures against performance/reduction targets for the year-to-date. All seven districts of Leicestershire are covered along with Leicester City, and an overall view of Leicestershire and the Force Area.
For more information,...

Crime Reduction Dashboards (September 2012)
Mon, 22 Oct 2012 09:45
The Crime Reduction Dashboards provide a visual indication of recorded crime figures against performance/reduction targets for the year-to-date. All seven districts of Leicestershire are covered along with Leicester City, and an overall view of Leicestershire and the Force Area.
For more information,...

Crime Reduction Dashboards (Year End 2008/9)
Mon, 08 Jun 2009 10:36
The Crime Reduction Dashboards provide a visual indication of recorded crime figures against performance/reduction targets. All seven districts of Leicestershire are covered along with Leicester City, and an overall view of Leicestershire and the Force Area.
For more information, please contact:
Karen...

Domestic Abuse Dashboard : Quarter 3 2011/12
Fri, 27 Jan 2012 10:03
The Domestic Abuse Dashboard provides a visual indication of recorded offences and non-recordable incidents of domestic abuse reported to the Police in Leicestershire County for the current year-to-date compared to the same period last year. Figures are provided for all seven districts of Leicestershire....

Domestic Abuse Dashboard Quarter 2 - 2012/13
Fri, 02 Nov 2012 12:46
The Domestic Abuse Dashboard provides a visual indication of recorded offences and non-recordable incidents of domestic abuse reported to the Police in Leicestershire County for the current year-to-date compared to the same period last year. Figures are provided for all seven districts of Leicestershire....

Domestic Abuse Dashboard: Quarter 1 - 2012/13
Mon, 30 Jul 2012 15:17
The Domestic Abuse Dashboard provides a visual indication of recorded offences and non-recordable incidents of domestic abuse reported to the Police in Leicestershire County for the current year-to-date compared to the same period last year. Figures are provided for all seven districts of Leicestershire....