Displaying 1 to 40 of 111

2001 Census Output Area Classifications
Fri, 03 Oct 2008 14:52
The 2001 Area Classifications were created on behalf of the Office of National Statistics by the University of Leeds. The classification is used to group together geographic areas according to key characteristics common to the population in that grouping. These groupings are called clusters, and are...

Alcohol‐Related Crime & The Night‐time Economy
Thu, 13 Dec 2012 11:59
This analysis has been developed as part of the work of the Leicestershire Reducing Alcohol Misuse Programme and identifies;
• the key night time economy alcohol crime hotspot areas across the County;
• a summary of the offender profiles based on police data;
• A summary of the offender profiles...

Anti-Social Behaviour Dashboard (April 2012)
Tue, 12 Jun 2012 12:56
The Anti-Social Behaviour (ASB) Dashboard provides a visual indication of the number of recorded ASB incidents against the previous year-to-date and long-term average. ASB incidents are broken down into three categories: personal, nuisance and environmental. All seven districts of Leicestershire are...
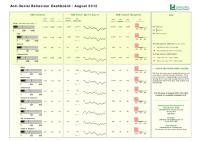
Anti-Social Behaviour Dashboard (Aug 2012)
Mon, 22 Oct 2012 09:51
The Anti-Social Behaviour (ASB) Dashboard provides a visual indication of the number of recorded ASB incidents against the previous year-to-date and long-term average. ASB incidents are broken down into three categories: personal, nuisance and environmental. All seven districts of Leicestershire are...

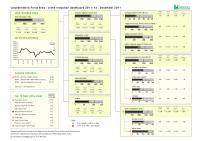
Anti-Social Behaviour Dashboard (December 2011)
Fri, 27 Jan 2012 09:47
The Anti-Social Behaviour (ASB) Dashboard provides a visual indication of the number of recorded ASB incidents against the previous year-to-date and long-term average. ASB incidents are broken down into three categories: personal, nuisance and environmental. All seven districts of Leicestershire are...

Anti-Social Behaviour Dashboard (February 2012)
Wed, 11 Apr 2012 09:34
The Anti-Social Behaviour (ASB) Dashboard provides a visual indication of the number of recorded ASB incidents against the previous year-to-date and long-term average. ASB incidents are broken down into three categories: personal, nuisance and environmental. All seven districts of Leicestershire are...
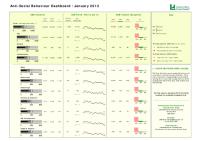
Anti-Social Behaviour Dashboard (January 2012)
Fri, 24 Feb 2012 11:34
The Anti-Social Behaviour (ASB) Dashboard provides a visual indication of the number of recorded ASB incidents against the previous year-to-date and long-term average. ASB incidents are broken down into three categories: personal, nuisance and environmental. All seven districts of Leicestershire are...

Anti-Social Behaviour Dashboard (July 2012)
Mon, 03 Sep 2012 12:27
The Anti-Social Behaviour (ASB) Dashboard provides a visual indication of the number of recorded ASB incidents against the previous year-to-date and long-term average. ASB incidents are broken down into three categories: personal, nuisance and environmental. All seven districts of Leicestershire are...

Anti-Social Behaviour Dashboard (June 2012)
Mon, 30 Jul 2012 15:25
The Anti-Social Behaviour (ASB) Dashboard provides a visual indication of the number of recorded ASB incidents against the previous year-to-date and long-term average. ASB incidents are broken down into three categories: personal, nuisance and environmental. All seven districts of Leicestershire are...

Anti-Social Behaviour Dashboard (March 2012)
Thu, 03 May 2012 13:28
The Anti-Social Behaviour (ASB) Dashboard provides a visual indication of the number of recorded ASB incidents against the previous year-to-date and long-term average. ASB incidents are broken down into three categories: personal, nuisance and environmental. All seven districts of Leicestershire are...
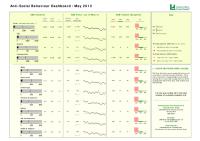
Anti-Social Behaviour Dashboard (May 2012)
Fri, 22 Jun 2012 13:34
The Anti-Social Behaviour (ASB) Dashboard provides a visual indication of the number of recorded ASB incidents against the previous year-to-date and long-term average. ASB incidents are broken down into three categories: personal, nuisance and environmental. All seven districts of Leicestershire are...
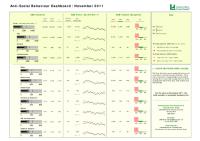
Anti-Social Behaviour Dashboard (November 2011)
Thu, 12 Jan 2012 09:27
The Anti-Social Behaviour (ASB) Dashboard provides a visual indication of the number of recorded ASB incidents against the previous year-to-date and long-term average. ASB incidents are broken down into three categories: personal, nuisance and environmental. All seven districts of Leicestershire are...

Anti-Social Behaviour Dashboard (September 2012)
Mon, 22 Oct 2012 09:53
The Anti-Social Behaviour (ASB) Dashboard provides a visual indication of the number of recorded ASB incidents against the previous year-to-date and long-term average. ASB incidents are broken down into three categories: personal, nuisance and environmental. All seven districts of Leicestershire are...
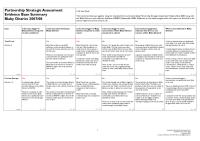
Blaby Community Safety Partnership : Evidence Base Summary 2008
Tue, 02 Dec 2008 13:38
This Community Safety Partnership Evidence Base Summary summarises the findings of the Leicestershire Community Safety Partnership Strategic Assessment 2008 for the Blaby Community Safety Partnership.
For more information, please contact:
Karen Earp
Research and Insight Officer
Research and Insight Team...

Blaby Community Safety Partnership Strategic Assessment 2011
Tue, 03 Apr 2012 12:12
The Partnership Strategic Assessment (PSA) is a statutory document produced annually to inform Community Safety Partnerships about crime, disorder and community safety issues in their area. The aim of this Strategic assessment is to provide Community Safety Partnerships with a comprehensive analysis...

Blaby CSP Strategic Assessment 2007
Fri, 18 Jan 2008 16:38
The Partnership Strategic Assessment provides knowledge and understanding of community safety problems that will inform and enable partners to develop their Community Safety Plan 2008-11

Blaby Priority Neighbourhood Profile: Central Enderby
Wed, 13 Feb 2008 09:57
The Blaby Priority Neighbourhood Profile for Central Enderby is now available. This profile provides a comprehensive overview of the Central Enderby intervention and monitoring areas. The report covers a range of useful baseline statistics for the area including information on demographics, deprivation,...

Bluetooth proximity marketing campaign - Coalville Town Centre
Thu, 18 Dec 2008 10:14
This report provides an overview and analysis of a collaborative project by Leicestershire Drug and Alcohol Action Team (DAAT), Leicestershire County Council, North West Leicestershire Partnership in Safer Communities, Hinckley and Bosworth Community Safety Partnership and Leicestershire Police to pilot...

Bluetooth proximity marketing campaign - Hinckley Town Centre
Thu, 18 Dec 2008 09:49
This report provides an overview and analysis of a collaborative project by Leicestershire Drug and Alcohol Action Team (DAAT), Leicestershire County Council, Hinckley and Bosworth Community Safety Partnership, North West Leicestershire Partnership in Safer Communities and Leicestershire Police to pilot...

Census 2011 - First Release
Mon, 23 Jul 2012 13:01
On 16th July 2012 the Office of National Statistics published the first of four Census releases. This first release contains detail on:
• Sex and age (at 5 year bands) of the population
• Number of households
• Population estimates (residents and those living in communal establishments)...

Charnwood Community Safety Partnership : Evidence Base Summary 2008
Tue, 02 Dec 2008 13:39
This Community Safety Partnership Evidence Base Summary summarises the findings of the Leicestershire Community Safety Partnership Strategic Assessment 2008 for the Charnwood Community Safety Partnership.
For more information, please contact:
Karen Earp
Research and Insight Officer
Research and Insight Team...

Charnwood Community Safety Partnership Strategic Assessment 2011
Mon, 16 Apr 2012 11:50
The Partnership Strategic Assessment (PSA) is a statutory document produced annually to inform Community Safety Partnerships about crime, disorder and community safety issues in their area. The aim of this Strategic assessment is to provide Community Safety Partnerships with a comprehensive analysis...

Charnwood CSP Strategic Assessment 2007
Mon, 25 Feb 2008 08:44
The Partnership Strategic Assessment provides knowledge and understanding of community safety problems that will inform and enable partners to develop their Community Safety Plan 2008-11

Charnwood Priority Neighbourhood Profile: Syston
Tue, 22 Jan 2008 15:35
The Charnwood Priority Neighbourhood Profile for Syston is now available. This profile provides a high level overview of the Syston intervention area. The report covers a range of useful baseline statistics for the area including information on demographics, deprivation, crime, economy, health, children...

Community Based Survey Results 2011/12 Q3
Mon, 13 Feb 2012 08:59
Leicestershire County Council and Leicestershire Police Authority have jointly commissioned the Community Based Survey, which replaces the previous community safety CRAVE Survey. The project combines key survey requirements of the County Council and Police Authority together into one consultation. As...

Community Based Survey Results 2011/12 Q4
Wed, 04 Apr 2012 08:48
Leicestershire County Council and Leicestershire Police Authority have jointly commissioned the Community Based Survey, which replaces the previous community safety CRAVE Survey. The project combines key survey requirements of the County Council and Police Authority together into one consultation. As...

Credit Crunch Report December 2008
Fri, 19 Dec 2008
This report, to be produced monthly, uses a range of information to assess the local impact of the credit crunch in the context of the national economic downturn. The report uses local datasets such as claimant data, housing sales and business optimism. Each month new data will be included to monitor...

Crime Reduction Dashboards (April 2012)
Mon, 11 Jun 2012 16:03
The Crime Reduction Dashboards provide a visual indication of recorded crime figures against performance/reduction targets for the year-to-date. All seven districts of Leicestershire are covered along with Leicester City, and an overall view of Leicestershire and the Force Area.
For more information,...

Crime Reduction Dashboards (August 2012)
Mon, 22 Oct 2012 09:37
The Crime Reduction Dashboards provide a visual indication of recorded crime figures against performance/reduction targets for the year-to-date. All seven districts of Leicestershire are covered along with Leicester City, and an overall view of Leicestershire and the Force Area.
For more information,...
Crime Reduction Dashboards (December 2011)
Fri, 27 Jan 2012 09:38
The Crime Reduction Dashboards provide a visual indication of recorded crime figures against performance/reduction targets for the year-to-date. All seven districts of Leicestershire are covered along with Leicester City, and an overall view of Leicestershire and the Force Area.
For more information,...

Crime Reduction Dashboards (February 2012)
Wed, 11 Apr 2012 09:10
The Crime Reduction Dashboards provide a visual indication of recorded crime figures against performance/reduction targets for the year-to-date. All seven districts of Leicestershire are covered along with Leicester City, and an overall view of Leicestershire and the Force Area.
For more information,...

Crime Reduction Dashboards (January 2012)
Fri, 24 Feb 2012 11:09
The Crime Reduction Dashboards provide a visual indication of recorded crime figures against performance/reduction targets for the year-to-date. All seven districts of Leicestershire are covered along with Leicester City, and an overall view of Leicestershire and the Force Area.
For more information,...

Crime Reduction Dashboards (July 2012)
Fri, 31 Aug 2012 11:45
The Crime Reduction Dashboards provide a visual indication of recorded crime figures against performance/reduction targets for the year-to-date. All seven districts of Leicestershire are covered along with Leicester City, and an overall view of Leicestershire and the Force Area.
For more information,...

Crime Reduction Dashboards (June 2012)
Mon, 30 Jul 2012 15:28
The Crime Reduction Dashboards provide a visual indication of recorded crime figures against performance/reduction targets for the year-to-date. All seven districts of Leicestershire are covered along with Leicester City, and an overall view of Leicestershire and the Force Area.
For more information,...

Crime Reduction Dashboards (March 2012)
Thu, 03 May 2012 13:03
The Crime Reduction Dashboards provide a visual indication of recorded crime figures against performance/reduction targets for the year-to-date. All seven districts of Leicestershire are covered along with Leicester City, and an overall view of Leicestershire and the Force Area.
For more information,...

Crime Reduction Dashboards (May 2012)
Fri, 22 Jun 2012 11:07
The Crime Reduction Dashboards provide a visual indication of recorded crime figures against performance/reduction targets for the year-to-date. All seven districts of Leicestershire are covered along with Leicester City, and an overall view of Leicestershire and the Force Area.
For more information,...

Crime Reduction Dashboards (November 2011)
Thu, 12 Jan 2012 09:06
The Crime Reduction Dashboards provide a visual indication of recorded crime figures against performance/reduction targets for the year-to-date. All seven districts of Leicestershire are covered along with Leicester City, and an overall view of Leicestershire and the Force Area.
For more information,...

Crime Reduction Dashboards (September 2012)
Mon, 22 Oct 2012 09:45
The Crime Reduction Dashboards provide a visual indication of recorded crime figures against performance/reduction targets for the year-to-date. All seven districts of Leicestershire are covered along with Leicester City, and an overall view of Leicestershire and the Force Area.
For more information,...

Deprivation Change in Leicestershire Priority Neighbourhoods
Tue, 10 Jun 2008 09:37
This report examines the change in IMD (Indices of Multiple Deprivation) ranking between 2004 and 2007 within LAA Priority Neighbourhoods. The document provides an outline to the process of identifying Priority Neighbourhoods and the role played by IMD in the initial work as well as an overview of the...

Domestic Abuse Dashboard : Quarter 3 2011/12
Fri, 27 Jan 2012 10:03
The Domestic Abuse Dashboard provides a visual indication of recorded offences and non-recordable incidents of domestic abuse reported to the Police in Leicestershire County for the current year-to-date compared to the same period last year. Figures are provided for all seven districts of Leicestershire....