Displaying 41 to 58 of 58

Mid-2012 Population Estimates at Lower Super Output Area (LSOA) Level - Gender Split by Broad Age Groups – February 2013
Thu, 20 Mar 2014
Office For National Statistics (ONS) published the Mid-2012 Population Estimates by LSOA on 17th October 2013. Revised population estimates for the period Mid 2002-2011 are available on the ONS website.
The following interactive dashboards shows mid-2012 Population Estimates for Leicestershire at Lower...
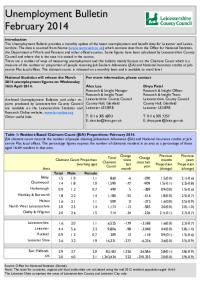
Unemployment Bulletin February 2014
Wed, 19 Mar 2014
The monthly unemployment bulletin contains a range of unemployment related statistics, covering Leicester, Leicestershire and Rutland. The JSA claimant data in this bulletin is available down to ward level. The JSA data is also available broken down by the detailed ethnic groups down to Local Authority...

Unemployment Bulletin January 2013
Thu, 20 Feb 2014
The monthly unemployment bulletin contains a range of unemployment related statistics, covering Leicester, Leicestershire and Rutland. The JSA claimant data in this bulletin is available down to ward level. The JSA data is also available broken down by the detailed ethnic groups down to Local Authority...

Director of Public Health Annual Report 2013
Mon, 03 Feb 2014
This is the last in a series of three reports from Leicestershire's Director of Public Health reviewing health across the life cycle. This report focuses on the health and wellbeing of working age adults. Earlier reports focussed on the health of children and the health of older people.
This report is...

Unemployment Bulletin December 2013
Wed, 22 Jan 2014
The monthly unemployment bulletin contains a range of unemployment related statistics, covering Leicester, Leicestershire and Rutland. The JSA claimant data in this bulletin is available down to ward level. The JSA data is also available broken down by the detailed ethnic groups down to Local Authority...

Unemployment Bulletin November 2013
Wed, 18 Dec 2013
The monthly unemployment bulletin contains a range of unemployment related statistics, covering Leicester, Leicestershire and Rutland. The JSA claimant data in this bulletin is available down to ward level. The JSA data is also available broken down by the detailed ethnic groups down to Local Authority...
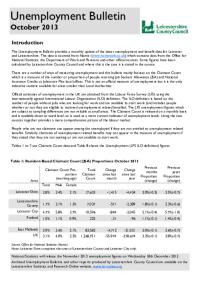
Unemployment Bulletin October 2013
Thu, 14 Nov 2013
The monthly unemployment bulletin contains a range of unemployment related statistics, covering Leicester, Leicestershire and Rutland. The JSA claimant data in this bulletin is available down to ward level. The JSA data is also available broken down by the detailed ethnic groups down to Local Authority...

Harborough Electoral Divisions - 2011 Census Key Stats
Wed, 29 May 2013 15:19
These reports provide a broad overview of the 2011 Census Key Statistics data, released by the Office for National Statistics on 30th January 2013, as part of the Census Second Release. The reports summarise a selection of key headline datasets of this release for Leicestershire Electoral Divisions (EDs)....

Unemployment Bulletin February 2013
Wed, 20 Mar 2013
The JSA claimant data in this bulletin is available down to ward level. The JSA data is also available broken down by the detailed ethnic groups down to Local Authority level.
The population figures used to calculate residence-based proportions (rates) have changed from working age (16-59f/64m) to aged...
Census 2011 - Open Atlas Project - Key Statistics information for districts
Tue, 12 Feb 2013 08:50
Alex Singleton, Lecturer in Geography at the University of Liverpool has mapped every Census Key Statistic at output area (OA) level for every local authority in England and Wales.
"Almost every non count variable (apart from Hectares) was mapped from the Key Statistics data disseminated by Nomis, and...

Unemployment Bulletin December 2012
Wed, 23 Jan 2013
The JSA claimant data in this bulletin is available down to ward level. The JSA data is also available broken down by the detailed ethnic groups down to Local Authority level.
The population figures used to calculate residence-based proportions (rates) have changed from working age (16-59f/64m) to aged...

Unemployment Bulletin November 2012
Wed, 12 Dec 2012
The JSA claimant data in this bulletin is available down to ward level. The JSA data is also available broken down by the detailed ethnic groups down to Local Authority level.
The population figures used to calculate residence-based proportions (rates) have changed from working age (16-59f/64m) to aged...

Unemployment Bulletin October 2012
Wed, 14 Nov 2012
The JSA claimant data in this bulletin is available down to ward level. The JSA data is also available broken down by the detailed ethnic groups down to Local Authority level.
The population figures used to calculate residence-based proportions (rates) have changed from working age (16-59f/64m) to aged...
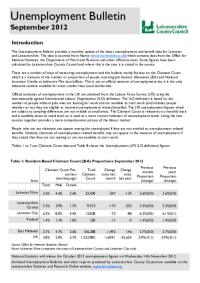
Unemployment Bulletin September 2012
Wed, 17 Oct 2012
The JSA claimant data in this bulletin is available down to ward level. The JSA data is also available broken down by the detailed ethnic groups down to Local Authority level.
The population figures used to calculate residence-based proportions (rates) have changed from working age (16-59f/64m) to aged...

Unemployment Bulletin August 2012
Wed, 12 Sep 2012
The JSA claimant data in this bulletin is available down to ward level. The JSA data is also available broken down by the detailed ethnic groups down to Local Authority level.
The population figures used to calculate residence-based proportions (rates) have changed from working age (16-59f/64m) to aged...
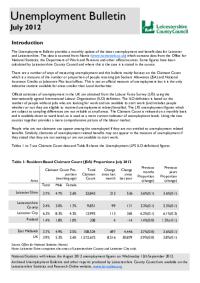
Unemployment Bulletin July 2012
Wed, 29 Aug 2012
The JSA claimant data in this bulletin is available down to ward level. The JSA data is also available broken down by the detailed ethnic groups down to Local Authority level.
The population figures used to calculate residence-based proportions (rates) have changed from working age (16-59f/64m) to aged...

Deprivation Change in Leicestershire Priority Neighbourhoods
Tue, 10 Jun 2008 09:37
This report examines the change in IMD (Indices of Multiple Deprivation) ranking between 2004 and 2007 within LAA Priority Neighbourhoods. The document provides an outline to the process of identifying Priority Neighbourhoods and the role played by IMD in the initial work as well as an overview of the...

Indices of Deprivation 2004 - Key Findings
Thu, 01 Nov 2007
The Indices of Deprivation 2004 are produced by the Office of the Deputy Prime Minister (ODPM). They are an attempt to measure deprivation in a consistent way for small areas across England. The following documents cover the individual districts of Leicestershire and Leicestershire county as a whole....