Displaying 1 to 40 of 52

These dashboards show relative performance compared to net expenditure per head and deprivation for Leicestershire and other local authorities, with a particular focus on two-tier county and county unitary areas.

The Benchmarking Analysis compares performance and expenditure outcomes in Leicestershire with those of other local authority areas.

The report provides an update on the performance of Leicestershire County Council and partners Safer Communities services. The report covers crime, youth justice, domestic abuse and anti-social behaviour.

The report and associated dashboard/s provide an update on the performance of Leicestershire County Council's Environment & Transport Services. The report covers: waste management; the Council's environmental impact and carbon emissions.

The dashboard/s and associated report provide an update on the performance of Leicestershire County Council's Highways & Transport Services. The dashboard covers: road safety; highways maintenance; strategic transport and reducing congestion; and sustainable travel.

The report and associated dashboard provide Leicestershire County Council's update on local health and wellbeing priorities. The report covers Better Care Fund performance (including care home admissions, delayed transfers of care, falls).

Children & Families Department Performance Report Quarter 3, 2023/24
Tue, 05 Mar 2024
Richard Wilding
The report and associated dashboard provide an update on the performance of Leicestershire County Council's Children & Family Services Department. The report covers children's social care services (including child protection, children in care and care leavers), educational attainment and progression,...

Adults & Communities Department - Quarter 2, 2023/24 and Benchmarking 2022/23
Mon, 22 Jan 2024
Richard Wilding
The report and associated dashboard provide an update on the performance of Leicestershire County Council's Adults and Communities Department. The report covers adult social care services (including residential admissions, hospital discharge & reablement, personalisation and adult safeguarding),...

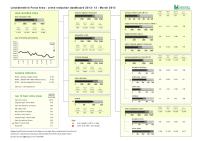
The monthly unemployment bulletin contains a range of unemployment related statistics, covering Leicester, Leicestershire and Rutland. The JSA claimant data in this bulletin is available down to ward level. The JSA data is also available broken down by the detailed ethnic groups down to Local Authority...

This year's report presents on the changing population of Leicestershire, the prevalence of individual and multiple conditions (otherwise known as multiple morbidity) in the population and data on excess winter deaths and place of death. The growing number of people living with multiple health conditions...

Annual Report of the Director of Public Health 2018 - Black and White Version
Tue, 11 Dec 2018
Natalie Davison
This year's report presents on the changing population of Leicestershire, the prevalence of individual and multiple conditions (otherwise known as multiple morbidity) in the population and data on excess winter deaths and place of death. The growing number of people living with multiple health conditions...

The monthly unemployment bulletin contains a range of unemployment related statistics, covering Leicester, Leicestershire and Rutland. The JSA claimant data in this bulletin is available down to ward level. The JSA data is also available broken down by the detailed ethnic groups down to Local Authority...

The monthly unemployment bulletin contains a range of unemployment related statistics, covering Leicester, Leicestershire and Rutland. The JSA claimant data in this bulletin is available down to ward level. The JSA data is also available broken down by the detailed ethnic groups down to Local Authority...

The monthly unemployment bulletin contains a range of unemployment related statistics, covering Leicester, Leicestershire and Rutland. The JSA claimant data in this bulletin is available down to ward level. The JSA data is also available broken down by the detailed ethnic groups down to Local Authority...
The Leicestershire Rural Partnership (LRP) commissioned the county council to produce a rural evidence base in order to present a comprehensive picture of rural Leicestershire. It is intended that the report will assist the LRP in responding to key national and local consultations to assist with influencing...
This is an evaluation of Leicestershire County Council's Early Help Service. The evaluation covers Early Help families which were supported by a case worker from the Supporting Leicestershire Families Service and Children's Centre's who received an assessed service during 2013 and 2017.
The monthly unemployment bulletin contains a range of unemployment related statistics, covering Leicester, Leicestershire and Rutland. The JSA claimant data in this bulletin is available down to ward level. The JSA data is also available broken down by the detailed ethnic groups down to Local Authority...

The monthly unemployment bulletin contains a range of unemployment related statistics, covering Leicester, Leicestershire and Rutland. The JSA claimant data in this bulletin is available down to ward level. The JSA data is also available broken down by the detailed ethnic groups down to Local Authority...

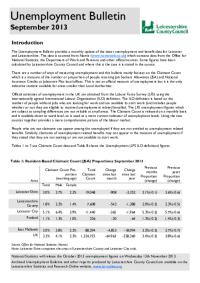
Unemployment Bulletin November 2013
Wed, 18 Dec 2013
The monthly unemployment bulletin contains a range of unemployment related statistics, covering Leicester, Leicestershire and Rutland. The JSA claimant data in this bulletin is available down to ward level. The JSA data is also available broken down by the detailed ethnic groups down to Local Authority...

2011 Census - Diversity and Ethnic and Religious Mixing
Thu, 28 Nov 2013 10:19
The two briefings below use data from the 1991, 2001 and 2011 Censuses to explore diversity and ethnic and religious mixing in Leicester and Leicestershire.
Key findings include:
- The ethnic minority population, as measured by non-white residents, increased between 1991 and 2011 by 34,000 in Leicestershire...
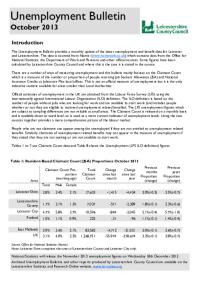
Unemployment Bulletin October 2013
Thu, 14 Nov 2013
The monthly unemployment bulletin contains a range of unemployment related statistics, covering Leicester, Leicestershire and Rutland. The JSA claimant data in this bulletin is available down to ward level. The JSA data is also available broken down by the detailed ethnic groups down to Local Authority...

Crime Reduction Dashboards (September 2013)
Mon, 04 Nov 2013 10:53
The Crime Reduction data is available as a fully interactive dashboard in tableau available here.
(N.B. You will need Internet Explorer 8 or above, Google Chrome or latest Firefox to view the dashboard)
A PDF version can be downloaded below.
The Crime Reduction Dashboards provide a visual indication of...
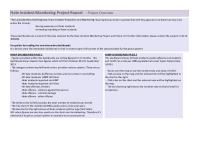
Hate Incident Monitoring Project Dashboard: Quarter2 – 2013/14
Fri, 01 Nov 2013 11:12
New ! The Hate Incident Monitoring Project (HIMP) data is now available as a fully interactive dashboard in tableau available here.
A PDF version can be downloaded below.
The Hate Incident Monitoring Project Dashboard provides a quarterly summary of the number of hate incidents reported to the Police...
Unemployment Bulletin September 2013
Thu, 17 Oct 2013
The JSA claimant data in this bulletin is available down to ward level. The JSA data is also available broken down by the detailed ethnic groups down to Local Authority level.
The population figures used to calculate residence-based proportions (rates) have changed from working age (16-59f/64m) to aged...
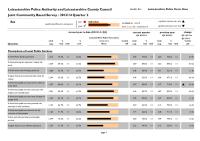
Community Based Survey Results 2013/14 Q2
Wed, 16 Oct 2013 12:33
Leicestershire County Council and Leicestershire Police Authority have jointly commissioned the Community Based Survey, which replaces the previous community safety CRAVE Survey. The project combines key survey requirements of the County Council and Police Authority together into one consultation. As...

Census 2011 - Transport
Mon, 23 Sep 2013 16:00
On January 30th, 2013, ONS released a range of data from the 2011 Census at a small area level. The report and interactive dashboards below analyse data from the two transport-related census questions:
- Car and Van Availability
- Method of Travel to work
The first dashboard presents data from both questions...
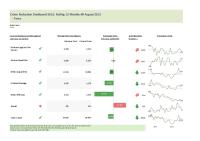
Crime Reduction Dashboards (August 2013)
Mon, 16 Sep 2013 15:09
The Crime Reduction data is available as a fully interactive dashboard in tableau available here.
(N.B. You will need Internet Explorer 8 or above, Google Chrome or latest Firefox to view the dashboard)
A PDF version can be downloaded below.
The Crime Reduction Dashboards provide a visual indication of...

Unemployment Bulletin August 2013
Wed, 11 Sep 2013
The JSA claimant data in this bulletin is available down to ward level. The JSA data is also available broken down by the detailed ethnic groups down to Local Authority level.
The population figures used to calculate residence-based proportions (rates) have changed from working age (16-59f/64m) to aged...
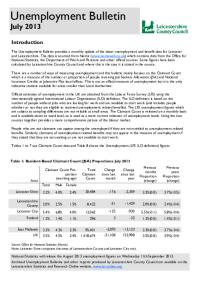
Unemployment Bulletin July 2013
Mon, 02 Sep 2013
The JSA claimant data in this bulletin is available down to ward level. The JSA data is also available broken down by the detailed ethnic groups down to Local Authority level.
The population figures used to calculate residence-based proportions (rates) have changed from working age (16-59f/64m) to aged...

Crime Reduction Dashboards (July 2013)
Thu, 29 Aug 2013 10:55
The Crime Reduction Dashboards provide a visual indication of recorded crime figures against performance/reduction targets for the year-to-date. All seven districts of Leicestershire are covered along with Leicester City, and an overall view of Leicestershire and the Force Area. (Tableau dashboards to...
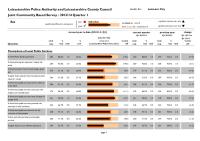
Community Based Survey Results 2013/14 Q1
Mon, 05 Aug 2013 11:17
Leicestershire County Council and Leicestershire Police Authority have jointly commissioned the Community Based Survey, which replaces the previous community safety CRAVE Survey. The project combines key survey requirements of the County Council and Police Authority together into one consultation. As...
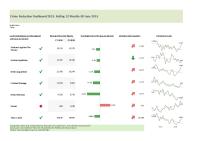
Crime Reduction Dashboards (June 2013)
Thu, 25 Jul 2013 15:43
The Crime Reduction Dashboards provide a visual indication of recorded crime for the current rolling 12 months against the previous 12 months. All seven districts of Leicestershire are covered along with Leicester City, and an overall view of Leicestershire and the Force Area.
For more information, please...

Hate Incident Monitoring Project Dashboard: Quarter 1 – 2013/14
Mon, 22 Jul 2013 12:20
New ! The Hate Incident Monitoring Project (HIMP) data is now available as a fully interactive dashboard in tableau available here.
A PDF version can be downloaded below.
The Hate Incident Monitoring Project Dashboard provides a quarterly summary of the number of hate incidents reported to the Police...

Unemployment Bulletin June 2013
Wed, 17 Jul 2013
The JSA claimant data in this bulletin is available down to ward level. The JSA data is also available broken down by the detailed ethnic groups down to Local Authority level.
The population figures used to calculate residence-based proportions (rates) have changed from working age (16-59f/64m) to aged...

Physical Activity Needs Assessment
Mon, 15 Jul 2013
This report provides a health needs assessment (HNA) for physical activity and sport to support and inform a physical activity and sport strategy.
The aim of this HNA is to: identify met and unmet needs in adults and children related to physical activity and sport across Leicestershire and Rutland.
Evidence...

Unemployment Bulletin May 2013
Thu, 13 Jun 2013
The JSA claimant data in this bulletin is available down to ward level. The JSA data is also available broken down by the detailed ethnic groups down to Local Authority level.
The population figures used to calculate residence-based proportions (rates) have changed from working age (16-59f/64m) to aged...

Crime Reduction Dashboards (April 2013)
Fri, 31 May 2013 13:08
The Crime Reduction Dashboards provide a visual indication of recorded crime figures against performance/reduction targets for the year-to-date. All seven districts of Leicestershire are covered along with Leicester City, and an overall view of Leicestershire and the Force Area.
For more information,...
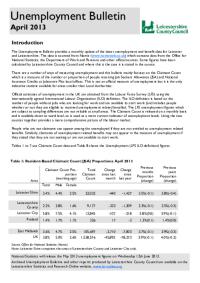
Unemployment Bulletin April 2013
Wed, 15 May 2013
The JSA claimant data in this bulletin is available down to ward level. The JSA data is also available broken down by the detailed ethnic groups down to Local Authority level.
The population figures used to calculate residence-based proportions (rates) have changed from working age (16-59f/64m) to aged...

Hate Incident Monitoring Project Dashboard: Quarter 4 – 2012/13
Thu, 02 May 2013 14:42
The Hate Incident Monitoring Project Dashboard provides a quarterly summary of the number of hate incidents reported to the Police, HIMP and in schools. Performance information is available for Leicestershire and each of the seven district Community Safety Partnerships. The reverse of the dashboard shows...
Crime Reduction Dashboards (March 2013)
Thu, 02 May 2013 14:21
The Crime Reduction Dashboards provide a visual indication of recorded crime figures against performance/reduction targets for the year-to-date. All seven districts of Leicestershire are covered along with Leicester City, and an overall view of Leicestershire and the Force Area.
For more information,...