Displaying 1 to 40 of 147

Active People KPI1 small area estimates for Leicester
Mon, 10 Dec 2007 14:14
The Active People Survey is the largest ever survey of sport and active recreation to be undertaken by Sport England in Europe. Key Performance Indicator (KPI) #1 is the numbers of people participating moderately in physical activity for thirty minutes three times a week. This thematic map of Leicester...

Active People KPI1 small area estimates for Hinckley and Bosworth
Mon, 10 Dec 2007 14:19
The Active People Survey is the largest ever survey of sport and active recreation to be undertaken by Sport England in Europe. Key Performance Indicator (KPI) #1 is the numbers of people participating moderately in physical activity for thirty minutes three times a week. This thematic map of Hinckley...

Active People KPI1 small area estimates for Melton
Mon, 10 Dec 2007 14:20
The Active People Survey is the largest ever survey of sport and active recreation to be undertaken by Sport England in Europe. Key Performance Indicator (KPI) #1 is the numbers of people participating moderately in physical activity for thirty minutes three times a week. This thematic map of the Melton...

Active People KPI1 small area estimates for Harborough
Mon, 10 Dec 2007 14:21
The Active People Survey is the largest ever survey of sport and active recreation to be undertaken by Sport England in Europe. Key Performance Indicator (KPI) #1 is the numbers of people participating moderately in physical activity for thirty minutes three times a week. This thematic map of the Harborough...

Active People KPI1 small area estimates for Oadby and Wigston
Mon, 10 Dec 2007 14:22
The Active People Survey is the largest ever survey of sport and active recreation to be undertaken by Sport England in Europe. Key Performance Indicator (KPI) #1 is the numbers of people participating moderately in physical activity for thirty minutes three times a week. This thematic map of Oadby and...

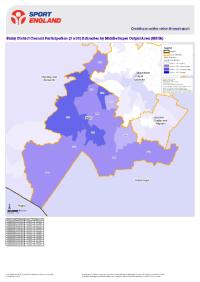
Active People KPI1 small area estimates for Charnwood
Mon, 10 Dec 2007 14:22
The Active People Survey is the largest ever survey of sport and active recreation to be undertaken by Sport England in Europe. Key Performance Indicator (KPI) #1 is the numbers of people participating moderately in physical activity for thirty minutes three times a week. This thematic map of the Charnwood...

Active People KPI1 small area estimates for North West Leicestershire
Mon, 10 Dec 2007 14:23
The Active People Survey is the largest ever survey of sport and active recreation to be undertaken by Sport England in Europe. Key Performance Indicator (KPI) #1 is the numbers of people participating moderately in physical activity for thirty minutes three times a week. This thematic map of North West...
Active People KPI1 small area estimates for Blaby
Mon, 10 Dec 2007 14:24
The Active People Survey is the largest ever survey of sport and active recreation to be undertaken by Sport England in Europe. Key Performance Indicator (KPI) #1 is the numbers of people participating moderately in physical activity for thirty minutes three times a week. This thematic map of Blaby district...

Social Capital Survey 2007
Wed, 11 Feb 2009 15:58
As part of the Stronger Communities Block of the Leicestershire Local Area Agreement (LAA), the Communities and Voluntary Sector (CVS), DeMontfort University and Leicestershire County Council conducted a survey that attempted to baseline levels of social capital in 20 areas across Leicestershire.
Social...

Leicester Residents' Survey 2008
Tue, 17 Mar 2009 12:50
Leicester City Council conducted a survey with NHS Leicester City to measure residents attitudes towards the council and its services. The report covers the satisfaction levels with the city council, the city as a place to live, community cohesion and safety.
Along with the documents attached, further...

Social Capital Survey Report 2010
Wed, 06 Jan 2010 15:57
As part of the Stronger Communities Block of the Leicestershire Local Area Agreement (LAA), the Communities and Voluntary Sector (CVS), DeMontfort University and Leicestershire County Council conducted a survey that attempted to baseline levels of social capital in 20 areas across Leicestershire. The...

Hate Incident Monitoring Project Dashboard
Tue, 22 Nov 2011 14:11
The Hate Incident Monitoring Project Dashboard provides a quarterly summary of the number of hate incidents reported to the Police and to the HIMP (and Leicestershire Schools - Quarter 4 only). The dashboard provides an indication of the progress towards the target to increase the reporting of hate incidents...

Crime Reduction Dashboards (January 2012)
Fri, 24 Feb 2012 11:09
The Crime Reduction Dashboards provide a visual indication of recorded crime figures against performance/reduction targets for the year-to-date. All seven districts of Leicestershire are covered along with Leicester City, and an overall view of Leicestershire and the Force Area.
For more information,...

Crime Reduction Dashboards (February 2012)
Wed, 11 Apr 2012 09:10
The Crime Reduction Dashboards provide a visual indication of recorded crime figures against performance/reduction targets for the year-to-date. All seven districts of Leicestershire are covered along with Leicester City, and an overall view of Leicestershire and the Force Area.
For more information,...

Crime Reduction Dashboards (March 2012)
Thu, 03 May 2012 13:03
The Crime Reduction Dashboards provide a visual indication of recorded crime figures against performance/reduction targets for the year-to-date. All seven districts of Leicestershire are covered along with Leicester City, and an overall view of Leicestershire and the Force Area.
For more information,...

Crime Reduction Dashboards (April 2012)
Mon, 11 Jun 2012 16:03
The Crime Reduction Dashboards provide a visual indication of recorded crime figures against performance/reduction targets for the year-to-date. All seven districts of Leicestershire are covered along with Leicester City, and an overall view of Leicestershire and the Force Area.
For more information,...

Crime Reduction Dashboards (May 2012)
Fri, 22 Jun 2012 11:07
The Crime Reduction Dashboards provide a visual indication of recorded crime figures against performance/reduction targets for the year-to-date. All seven districts of Leicestershire are covered along with Leicester City, and an overall view of Leicestershire and the Force Area.
For more information,...

Crime Reduction Dashboards (June 2012)
Mon, 30 Jul 2012 15:28
The Crime Reduction Dashboards provide a visual indication of recorded crime figures against performance/reduction targets for the year-to-date. All seven districts of Leicestershire are covered along with Leicester City, and an overall view of Leicestershire and the Force Area.
For more information,...

Local Tobacco Control Profiles
Tue, 28 Aug 2012 09:28
Summary of local tobacco control profiles for Leicestershire and Rutland

Crime Reduction Dashboards (July 2012)
Fri, 31 Aug 2012 11:45
The Crime Reduction Dashboards provide a visual indication of recorded crime figures against performance/reduction targets for the year-to-date. All seven districts of Leicestershire are covered along with Leicester City, and an overall view of Leicestershire and the Force Area.
For more information,...

Crime Reduction Dashboards (August 2012)
Mon, 22 Oct 2012 09:37
The Crime Reduction Dashboards provide a visual indication of recorded crime figures against performance/reduction targets for the year-to-date. All seven districts of Leicestershire are covered along with Leicester City, and an overall view of Leicestershire and the Force Area.
For more information,...

Crime Reduction Dashboards (September 2012)
Mon, 22 Oct 2012 09:45
The Crime Reduction Dashboards provide a visual indication of recorded crime figures against performance/reduction targets for the year-to-date. All seven districts of Leicestershire are covered along with Leicester City, and an overall view of Leicestershire and the Force Area.
For more information,...
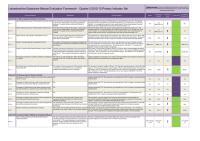
Leicestershire Substance Misuse Evaluation Framework Dashboard
Wed, 23 Jan 2013 08:33
The Leicestershire Substance Misuse Evaluation Framework Dashboard provides a visual indication of performance against compliance levels for key performance indicators of drug and alcohol misuse from a range of partner agencies. All seven districts of Leicestershire form the dataset.
Two dashboards will...

Anti-Social Behaviour Dashboard (Oct 2012)
Thu, 31 Jan 2013 10:12
The Anti-Social Behaviour (ASB) Dashboard provides a visual indication of the number of recorded ASB incidents against the previous year-to-date and long-term average. ASB incidents are broken down into three categories: personal, nuisance and environmental. All seven districts of Leicestershire are...

Anti-Social Behaviour Dashboard (Nov 2012)
Thu, 31 Jan 2013 10:14
The Anti-Social Behaviour (ASB) Dashboard provides a visual indication of the number of recorded ASB incidents against the previous year-to-date and long-term average. ASB incidents are broken down into three categories: personal, nuisance and environmental. All seven districts of Leicestershire are...

Anti-Social Behaviour Dashboard (Dec 2012)
Thu, 31 Jan 2013 10:21
The Anti-Social Behaviour (ASB) Dashboard provides a visual indication of the number of recorded ASB incidents against the previous year-to-date and long-term average. ASB incidents are broken down into three categories: personal, nuisance and environmental. All seven districts of Leicestershire are...

Crime Reduction Dashboards (December 2012)
Thu, 31 Jan 2013 10:25
The Crime Reduction Dashboards provide a visual indication of recorded crime figures against performance/reduction targets for the year-to-date. All seven districts of Leicestershire are covered along with Leicester City, and an overall view of Leicestershire and the Force Area.
For more information,...

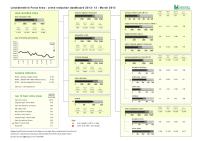
Domestic Abuse Dashboard: Quarter 3 - 2012/13
Fri, 01 Feb 2013 10:29
The Domestic Abuse Dashboard provides a visual indication of recorded offences and non-recordable incidents of domestic abuse reported to the Police in Leicestershire County for the current year-to-date compared to the same period last year. Figures are provided for all seven districts of Leicestershire....

Community Based Survey Results 2012/13 Q3
Fri, 01 Feb 2013 14:17
Leicestershire County Council and Leicestershire Police Authority have jointly commissioned the Community Based Survey, which replaces the previous community safety CRAVE Survey. The project combines key survey requirements of the County Council and Police Authority together into one consultation. As...

Census 2011 - LSOA population by sex and five year age bands
Mon, 18 Feb 2013 14:25
Leicestershire County Council
The following interactive dashboard contains information on population for Leicestershire Lower Super Output Areas (LSOAs).
Census 2011 LSOA population dashboard by sex and quinary age (N.B. requires Internet Explorer 8 and above or comparable browser).
LSOAs are small units of geography (containing, on...

The second phase of the 2011 Census Second Release was released on December 11th. This release includes a range of socio-economic data at national, regional and local authority level. This report summarises the key findings of this release for Leicestershire by the following broad themes:
- Age, Sex and...

Social Return on Investment (SROI) Evaluation of the Leicestershire and Rutland Community Safer Sex Project
Wed, 20 Feb 2013 16:18
This report uses the Social Return on Investment (SROI) methodology to explore the value of the Community Safer Sex Project (CSSP) in terms of who is affected by the project and what changes for them. The Community Safer Sex Project (CSSP) was established in 2001 to support the emerging Teenage Pregnancy...

Crime Reduction Dashboards (January 2013)
Tue, 05 Mar 2013 14:16
The Crime Reduction Dashboards provide a visual indication of recorded crime figures against performance/reduction targets for the year-to-date. All seven districts of Leicestershire are covered along with Leicester City, and an overall view of Leicestershire and the Force Area.
For more information,...

Anti-Social Behaviour Dashboard (January 2013)
Tue, 05 Mar 2013 14:18
The Anti-Social Behaviour (ASB) Dashboard provides a visual indication of the number of recorded ASB incidents against the previous year-to-date and long-term average. ASB incidents are broken down into three categories: personal, nuisance and environmental. All seven districts of Leicestershire are...

Anti-Social Behaviour Dashboard (February 2013)
Fri, 05 Apr 2013 13:57
The Anti-Social Behaviour (ASB) Dashboard provides a visual indication of the number of recorded ASB incidents against the previous year-to-date and long-term average. ASB incidents are broken down into three categories: personal, nuisance and environmental. All seven districts of Leicestershire are...

Crime Reduction Dashboards (February 2013)
Fri, 05 Apr 2013 13:58
The Crime Reduction Dashboards provide a visual indication of recorded crime figures against performance/reduction targets for the year-to-date. All seven districts of Leicestershire are covered along with Leicester City, and an overall view of Leicestershire and the Force Area.
For more information,...

Mortality reports
Tue, 30 Apr 2013 15:37
Reports on the four most common causes of death (Cancer, Cardio Vascular Disease, Liver Disease and Respiratory Disease) for Leicestershire and Rutland. Describing trends, also benchmarking against similar areas in England
Crime Reduction Dashboards (March 2013)
Thu, 02 May 2013 14:21
The Crime Reduction Dashboards provide a visual indication of recorded crime figures against performance/reduction targets for the year-to-date. All seven districts of Leicestershire are covered along with Leicester City, and an overall view of Leicestershire and the Force Area.
For more information,...

Anti-Social Behaviour Dashboard (March 2013)
Thu, 02 May 2013 14:29
The Anti-Social Behaviour (ASB) Dashboard provides a visual indication of the number of recorded ASB incidents against the previous year-to-date and long-term average. ASB incidents are broken down into three categories: personal, nuisance and environmental. All seven districts of Leicestershire are...

Hate Incident Monitoring Project Dashboard: Quarter 4 – 2012/13
Thu, 02 May 2013 14:42
The Hate Incident Monitoring Project Dashboard provides a quarterly summary of the number of hate incidents reported to the Police, HIMP and in schools. Performance information is available for Leicestershire and each of the seven district Community Safety Partnerships. The reverse of the dashboard shows...