Displaying 1 to 40 of 148

Hate Incident Monitoring Project Dashboard: Quarter4 – 2015/16
Thu, 12 May 2016
The Hate Incident Monitoring Project (HIMP) data is available as an interactive dashboard.
A PDF version can be downloaded below.
The Hate Incident Monitoring Project Dashboard provides a quarterly summary of the number of hate incidents reported to the Police and HIMP as well as maps showing hate incident...

Hinckley & Bosworth CSP Strategic Assessment
Mon, 25 Feb 2008 08:50
The Partnership Strategic Assessment provides knowledge and understanding of community safety problems that will inform and enable partners to develop their Community Safety Plan 2008-11

Leicestershire Community Safety Partnership Strategic Assessment 2008
Tue, 02 Dec 2008 13:59
The purpose of this Evidence-Base document is to provide Community Safety Partnerships within Leicestershire with a comprehensive, robust and accurate picture of crime and disorder issues across the county. This Evidence-Base report provides the fundamental information to form the basis of the Partnership...

Leicestershire Community Safety : Evidence Base Summary 2008
Tue, 02 Dec 2008 13:59
This Community Safety Partnership Evidence Base Summary summarises the findings of the Leicestershire Community Safety Partnership Strategic Assessment 2008 for the Leicestershire County.

Hinckley and Bosworth Community Safety Partnership : Evidence Base Summary 2008
Tue, 02 Dec 2008 13:40
This Community Safety Partnership Evidence Base Summary summarises the findings of the Leicestershire Community Safety Partnership Strategic Assessment 2008 for the Hinckley and Bosworth Community Safety Partnership.
For more information, please contact:
Karen Earp
Research and Insight Officer
Research and...

Social Capital Survey 2007
Wed, 11 Feb 2009 15:58
As part of the Stronger Communities Block of the Leicestershire Local Area Agreement (LAA), the Communities and Voluntary Sector (CVS), DeMontfort University and Leicestershire County Council conducted a survey that attempted to baseline levels of social capital in 20 areas across Leicestershire.
Social...

Crime Reduction Dashboards (Year End 2008/9)
Mon, 08 Jun 2009 10:36
The Crime Reduction Dashboards provide a visual indication of recorded crime figures against performance/reduction targets. All seven districts of Leicestershire are covered along with Leicester City, and an overall view of Leicestershire and the Force Area.
For more information, please contact:
Karen...

Leicestershire Community Safety Partnership Strategic Assessment 2009
Wed, 23 Sep 2009 11:31
The Partnership Strategic Assessment provides a summary of the crime, disorder and substance misuse issues across Leicestershire during 2008/09. The information within this assessment is designed to aid the Leicestershire Safer Communities Strategy Board to review current and develop future strategic...

Anti-Social Behaviour Dashboard (Year End 2009/10)
Thu, 15 Apr 2010 17:11
The Anti-Social Behaviour (ASB) Dashboard provides a visual indication of the number of recorded ASB incidents against the previous year-to-date targets and long-term average. ASB incidents are broken down by category: Rowdy or Inconsiderate Behaviour, Vehicle Nuisance and Inappropriate Behaviour, Hoax...
Crime Reduction Dashboards (Year End 2009/10)
Thu, 15 Apr 2010 17:13
The Crime Reduction Dashboards provide a visual indication of recorded crime figures against performance/reduction targets for the year-to-date. All seven districts of Leicestershire are covered along with Leicester City, and an overall view of Leicestershire and the Force Area. The local reduction targets...

Crime Reduction Dashboards (May 2010)
Wed, 30 Jun 2010 13:25
The Crime Reduction Dashboards provide a visual indication of recorded crime figures against performance/reduction targets for the year-to-date. All seven districts of Leicestershire are covered along with Leicester City, and an overall view of Leicestershire and the Force Area. The local reduction targets...

Anti-Social Behaviour Dashboard (May 2010)
Wed, 30 Jun 2010 13:32
The Anti-Social Behaviour (ASB) Dashboard provides a visual indication of the number of recorded ASB incidents against the previous year-to-date targets and long-term average. ASB incidents are broken down by category: Rowdy or Inconsiderate Behaviour, Vehicle Nuisance and Inappropriate Behaviour, Hoax...

District Community Profiles 2005
Wed, 01 Nov 2006
These community profiles for the seven districts contains a range of data from a variety of sources and considers all aspects of the local community. They include chapters on crime, health, ethnicity, deprivation, education and the local economy.

District Area Profiles - Census 2001 Key Statistics
Sun, 01 Jan 2006
The 24 tables cover the main Census topics and consist of approximately 375 counts. These tables are resently available only at local authority district,county, unitary, regional and national level. These area profiles provides a summary of key data for Leicestershire Districts,County, East Midlands...
Crime Reduction Dashboards (June 2010)
Tue, 20 Jul 2010 15:14
The Crime Reduction Dashboards provide a visual indication of recorded crime figures against performance/reduction targets for the year-to-date. All seven districts of Leicestershire are covered along with Leicester City, and an overall view of Leicestershire and the Force Area. The local reduction targets...
Anti-Social Behaviour Dashboard (June 2010)
Tue, 20 Jul 2010 15:19
The Anti-Social Behaviour (ASB) Dashboard provides a visual indication of the number of recorded ASB incidents against the previous year-to-date targets and long-term average. ASB incidents are broken down by category: Rowdy or Inconsiderate Behaviour, Vehicle Nuisance and Inappropriate Behaviour, Hoax...

Hinckley & Bosworth Ward Profiles - Census 2001
Mon, 31 Jan 2005 15:45
1)The profiles below provide a summary of all the main Census topics for each ward in the District. The profiles have been compiled using the Key Statistics Tables series released by the Office of National Statistics in 2003 and also provide comparison figures for the District and County areas.
Please...

Hinckley & Bosworth Parish Profiles - Census 2001
Mon, 31 Jan 2005 15:45
Simple 'Profiles' containing around 100 variables have been created for all Parishes in Leicestershire with at least 50 residents and 20 households. The themes covered are: People; Households; Work & Qualifications and Accommodation & Tenure. These profiles have not been released for higher geographies,...

Hinckley & Bosworth Electoral Division Profiles - Census 2001 Key Statistics
Mon, 31 Jan 2005 15:45
Following the recent boundary changes in Leicestershire, these area profiles provides a summary of the key data for an Electoral Division using the 2001 Census.

Crime Reduction Dashboards (July 2010)
Fri, 20 Aug 2010 13:45
The Crime Reduction Dashboards provide a visual indication of recorded crime figures against performance/reduction targets for the year-to-date. All seven districts of Leicestershire are covered along with Leicester City, and an overall view of Leicestershire and the Force Area. The local reduction targets...

Anti-Social Behaviour Dashboard (July 2010)
Fri, 20 Aug 2010 13:53
The Anti-Social Behaviour (ASB) Dashboard provides a visual indication of the number of recorded ASB incidents against the previous year-to-date targets and long-term average. ASB incidents are broken down by category: Rowdy or Inconsiderate Behaviour, Vehicle Nuisance and Inappropriate Behaviour, Hoax...

Anti-Social Behaviour Dashboard (August 2010)
Mon, 11 Oct 2010 07:36
The Anti-Social Behaviour (ASB) Dashboard provides a visual indication of the number of recorded ASB incidents against the previous year-to-date targets and long-term average. ASB incidents are broken down by category: Rowdy or Inconsiderate Behaviour, Vehicle Nuisance and Inappropriate Behaviour, Hoax...

Crime Reduction Dashboards (August 2010)
Mon, 11 Oct 2010 07:37
The Crime Reduction Dashboards provide a visual indication of recorded crime figures against performance/reduction targets for the year-to-date. All seven districts of Leicestershire are covered along with Leicester City, and an overall view of Leicestershire and the Force Area. The local reduction targets...

Anti-Social Behaviour Dashboard (September 2010)
Wed, 20 Oct 2010 14:01
The Anti-Social Behaviour (ASB) Dashboard provides a visual indication of the number of recorded ASB incidents against the previous year-to-date targets and long-term average. ASB incidents are broken down by category: Rowdy or Inconsiderate Behaviour, Vehicle Nuisance and Inappropriate Behaviour, Hoax...

Crime Reduction Dashboards (September 2010)
Wed, 20 Oct 2010 14:02
The Crime Reduction Dashboards provide a visual indication of recorded crime figures against performance/reduction targets for the year-to-date. All seven districts of Leicestershire are covered along with Leicester City, and an overall view of Leicestershire and the Force Area. The local reduction targets...

Partnership Strategic Assessment 2010-11
Mon, 15 Nov 2010 13:37
The Partnership Strategic Assessment for Leicester, Leicestershire and Rutland brings together information regarding crime, disorder and community safety from across partner agencies to identify the longer-term issues impacting on Leicester, Leicestershire and Rutland, as well as the scope of, and projections...

Crime Reduction Dashboards (October 2010)
Thu, 18 Nov 2010 14:13
The Crime Reduction Dashboards provide a visual indication of recorded crime figures against performance/reduction targets for the year-to-date. All seven districts of Leicestershire are covered along with Leicester City, and an overall view of Leicestershire and the Force Area. The local reduction targets...

Anti-Social Behaviour Dashboard (October 2010)
Thu, 18 Nov 2010 14:20
The Anti-Social Behaviour (ASB) Dashboard provides a visual indication of the number of recorded ASB incidents against the previous year-to-date targets and long-term average. ASB incidents are broken down by category: Rowdy or Inconsiderate Behaviour, Vehicle Nuisance and Inappropriate Behaviour, Hoax...

Crime Reduction Dashboards (November 2010)
Mon, 10 Jan 2011 14:50
The Crime Reduction Dashboards provide a visual indication of recorded crime figures against performance/reduction targets for the year-to-date. All seven districts of Leicestershire are covered along with Leicester City, and an overall view of Leicestershire and the Force Area. The local reduction targets...

Anti-Social Behaviour Dashboard (November 2010)
Mon, 10 Jan 2011 14:58
The Anti-Social Behaviour (ASB) Dashboard provides a visual indication of the number of recorded ASB incidents against the previous year-to-date targets and long-term average. ASB incidents are broken down by category: Rowdy or Inconsiderate Behaviour, Vehicle Nuisance and Inappropriate Behaviour, Hoax...

Crime Reduction Dashboards (December 2010)
Thu, 27 Jan 2011 16:50
The Crime Reduction Dashboards provide a visual indication of recorded crime figures against performance/reduction targets for the year-to-date. All seven districts of Leicestershire are covered along with Leicester City, and an overall view of Leicestershire and the Force Area. The local reduction targets...

Anti-Social Behaviour Dashboard (December 2010)
Fri, 28 Jan 2011 10:48
The Anti-Social Behaviour (ASB) Dashboard provides a visual indication of the number of recorded ASB incidents against the previous year-to-date targets and long-term average. ASB incidents are broken down by category: Rowdy or Inconsiderate Behaviour, Vehicle Nuisance and Inappropriate Behaviour, Hoax...
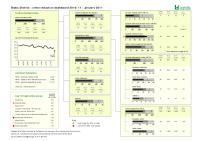
Crime Reduction Dashboards (January 2011)
Tue, 01 Mar 2011 09:14
The Crime Reduction Dashboards provide a visual indication of recorded crime figures against performance/reduction targets for the year-to-date. All seven districts of Leicestershire are covered along with Leicester City, and an overall view of Leicestershire and the Force Area. The local reduction targets...
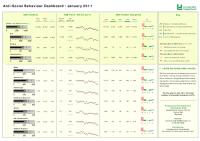
Anti-Social Behaviour Dashboard (January 2011)
Tue, 01 Mar 2011 09:27
The Anti-Social Behaviour (ASB) Dashboard provides a visual indication of the number of recorded ASB incidents against the previous year-to-date targets and long-term average. ASB incidents are broken down by category: Rowdy or Inconsiderate Behaviour, Vehicle Nuisance and Inappropriate Behaviour, Hoax...

Anti-Social Behaviour Dashboard (March 2011)
Tue, 26 Apr 2011 17:35
The Anti-Social Behaviour (ASB) Dashboard provides a visual indication of the number of recorded ASB incidents against the previous year-to-date targets and long-term average. ASB incidents are broken down by category: Rowdy or Inconsiderate Behaviour, Vehicle Nuisance and Inappropriate Behaviour, Hoax...

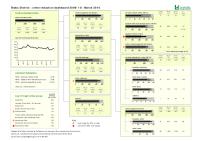
Crime Reduction Dashboards (March 2011)
Tue, 26 Apr 2011 17:39
The Crime Reduction Dashboards provide a visual indication of recorded crime figures against performance/reduction targets for the year-to-date. All seven districts of Leicestershire are covered along with Leicester City, and an overall view of Leicestershire and the Force Area. The local reduction targets...

Crime Reduction Dashboards (May 2011)
Fri, 15 Jul 2011 08:53
The Crime Reduction Dashboards provide a visual indication of recorded crime figures against performance/reduction targets for the year-to-date. All seven districts of Leicestershire are covered along with Leicester City, and an overall view of Leicestershire and the Force Area. The local reduction targets...

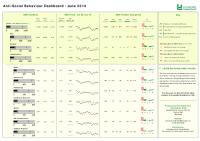
Anti-Social Behaviour Dashboard (May 2011)
Fri, 15 Jul 2011 15:00
The Anti-Social Behaviour (ASB) Dashboard provides a visual indication of the number of recorded ASB incidents against the previous year-to-date and long-term average. ASB incidents are broken down into three categories: personal, nuisance and environmental. All seven districts of Leicestershire are...
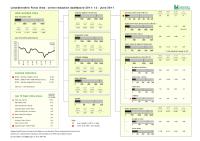
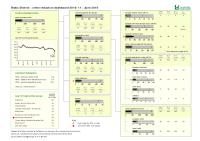
Crime Reduction Dashboards (June 2011)
Thu, 28 Jul 2011 16:15
The Crime Reduction Dashboards provide a visual indication of recorded crime figures against performance/reduction targets for the year-to-date. All seven districts of Leicestershire are covered along with Leicester City, and an overall view of Leicestershire and the Force Area. The local reduction targets...

Population Estimates Trends Updated to 2010
Tue, 02 Aug 2011 10:28
The Office for National Statistics (ONS) estimate of the mid-2010 population for Leicestershire is 648,700, and Leicester 306,600, with the Leicestershire and Leicester sub-region about 955,400 in estimated population. Office for National Statistics (ONS) published mid-2010 population estimates on 30th...