Displaying 161 to 200 of 306

Hate Incident Monitoring Project Dashboard
Tue, 22 Nov 2011 14:11
The Hate Incident Monitoring Project Dashboard provides a quarterly summary of the number of hate incidents reported to the Police and to the HIMP (and Leicestershire Schools - Quarter 4 only). The dashboard provides an indication of the progress towards the target to increase the reporting of hate incidents...

Report : Crime Reduction Dashboards (September 2011)
Tue, 08 Nov 2011 12:52
The Crime Reduction Dashboards provide a visual indication of recorded crime figures against performance/reduction targets for the year-to-date. All seven districts of Leicestershire are covered along with Leicester City, and an overall view of Leicestershire and the Force Area. The local reduction targets...

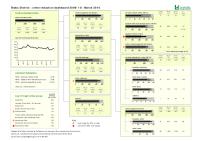
Report : Anti-Social Behaviour Dashboard (September 2011)
Tue, 08 Nov 2011 12:50
The Anti-Social Behaviour (ASB) Dashboard provides a visual indication of the number of recorded ASB incidents against the previous year-to-date and long-term average. ASB incidents are broken down into three categories: personal, nuisance and environmental. All seven districts of Leicestershire are...

Report : Anti-Social Behaviour Dashboard (July 2011)
Fri, 02 Sep 2011 10:32
The Anti-Social Behaviour (ASB) Dashboard provides a visual indication of the number of recorded ASB incidents against the previous year-to-date and long-term average. ASB incidents are broken down into three categories: personal, nuisance and environmental. All seven districts of Leicestershire are...

Crime Reduction Dashboards (July 2011)
Fri, 02 Sep 2011 09:18
The Crime Reduction Dashboards provide a visual indication of recorded crime figures against performance/reduction targets for the year-to-date. All seven districts of Leicestershire are covered along with Leicester City, and an overall view of Leicestershire and the Force Area. The local reduction targets...

Overseas migrant worker inflows to 2010
Thu, 11 Aug 2011 17:58
New registrations for National Insurance numbers by overseas nationals give an indication of the number of overseas workers in residence here for more than a year. The total number registering from January to December 2010 was over 7,000 in Leicester City and over 2,000 in Leicestershire County. The...
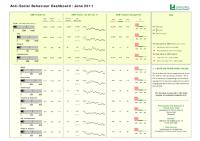
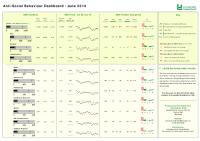
Report : Anti-Social Behaviour Dashboard (June 2011)
Thu, 04 Aug 2011 09:22
The Anti-Social Behaviour (ASB) Dashboard provides a visual indication of the number of recorded ASB incidents against the previous year-to-date and long-term average. ASB incidents are broken down into three categories: personal, nuisance and environmental. All seven districts of Leicestershire are...

Population Estimates Trends Updated to 2010
Tue, 02 Aug 2011 10:28
The Office for National Statistics (ONS) estimate of the mid-2010 population for Leicestershire is 648,700, and Leicester 306,600, with the Leicestershire and Leicester sub-region about 955,400 in estimated population. Office for National Statistics (ONS) published mid-2010 population estimates on 30th...
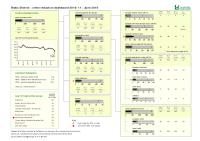
Crime Reduction Dashboards (June 2011)
Thu, 28 Jul 2011 16:15
The Crime Reduction Dashboards provide a visual indication of recorded crime figures against performance/reduction targets for the year-to-date. All seven districts of Leicestershire are covered along with Leicester City, and an overall view of Leicestershire and the Force Area. The local reduction targets...

Anti-Social Behaviour Dashboard (May 2011)
Fri, 15 Jul 2011 15:00
The Anti-Social Behaviour (ASB) Dashboard provides a visual indication of the number of recorded ASB incidents against the previous year-to-date and long-term average. ASB incidents are broken down into three categories: personal, nuisance and environmental. All seven districts of Leicestershire are...

Crime Reduction Dashboards (May 2011)
Fri, 15 Jul 2011 08:53
The Crime Reduction Dashboards provide a visual indication of recorded crime figures against performance/reduction targets for the year-to-date. All seven districts of Leicestershire are covered along with Leicester City, and an overall view of Leicestershire and the Force Area. The local reduction targets...

Leicester & Leicestershire SHMA Managing and Updating of Data
Wed, 27 Apr 2011 16:50
This project builds on the work in the Leicester & Leicestershire Strategic Housing Market Assessment in 2007/8. It involved engaging with multiple departments across each local authority in order to assess the capacity for collecting, using and maintaining data in relation to the Strategic Housing...

Crime Reduction Dashboards (March 2011)
Tue, 26 Apr 2011 17:39
The Crime Reduction Dashboards provide a visual indication of recorded crime figures against performance/reduction targets for the year-to-date. All seven districts of Leicestershire are covered along with Leicester City, and an overall view of Leicestershire and the Force Area. The local reduction targets...

Anti-Social Behaviour Dashboard (March 2011)
Tue, 26 Apr 2011 17:35
The Anti-Social Behaviour (ASB) Dashboard provides a visual indication of the number of recorded ASB incidents against the previous year-to-date targets and long-term average. ASB incidents are broken down by category: Rowdy or Inconsiderate Behaviour, Vehicle Nuisance and Inappropriate Behaviour, Hoax...
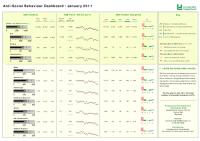
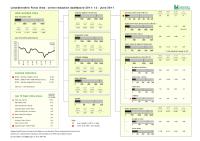
Anti-Social Behaviour Dashboard (January 2011)
Tue, 01 Mar 2011 09:27
The Anti-Social Behaviour (ASB) Dashboard provides a visual indication of the number of recorded ASB incidents against the previous year-to-date targets and long-term average. ASB incidents are broken down by category: Rowdy or Inconsiderate Behaviour, Vehicle Nuisance and Inappropriate Behaviour, Hoax...
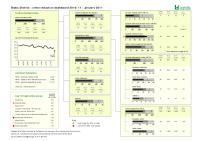
Crime Reduction Dashboards (January 2011)
Tue, 01 Mar 2011 09:14
The Crime Reduction Dashboards provide a visual indication of recorded crime figures against performance/reduction targets for the year-to-date. All seven districts of Leicestershire are covered along with Leicester City, and an overall view of Leicestershire and the Force Area. The local reduction targets...

Anti-Social Behaviour Dashboard (December 2010)
Fri, 28 Jan 2011 10:48
The Anti-Social Behaviour (ASB) Dashboard provides a visual indication of the number of recorded ASB incidents against the previous year-to-date targets and long-term average. ASB incidents are broken down by category: Rowdy or Inconsiderate Behaviour, Vehicle Nuisance and Inappropriate Behaviour, Hoax...

Crime Reduction Dashboards (December 2010)
Thu, 27 Jan 2011 16:50
The Crime Reduction Dashboards provide a visual indication of recorded crime figures against performance/reduction targets for the year-to-date. All seven districts of Leicestershire are covered along with Leicester City, and an overall view of Leicestershire and the Force Area. The local reduction targets...

Anti-Social Behaviour Dashboard (November 2010)
Mon, 10 Jan 2011 14:58
The Anti-Social Behaviour (ASB) Dashboard provides a visual indication of the number of recorded ASB incidents against the previous year-to-date targets and long-term average. ASB incidents are broken down by category: Rowdy or Inconsiderate Behaviour, Vehicle Nuisance and Inappropriate Behaviour, Hoax...

Crime Reduction Dashboards (November 2010)
Mon, 10 Jan 2011 14:50
The Crime Reduction Dashboards provide a visual indication of recorded crime figures against performance/reduction targets for the year-to-date. All seven districts of Leicestershire are covered along with Leicester City, and an overall view of Leicestershire and the Force Area. The local reduction targets...

Anti-Social Behaviour Dashboard (October 2010)
Thu, 18 Nov 2010 14:20
The Anti-Social Behaviour (ASB) Dashboard provides a visual indication of the number of recorded ASB incidents against the previous year-to-date targets and long-term average. ASB incidents are broken down by category: Rowdy or Inconsiderate Behaviour, Vehicle Nuisance and Inappropriate Behaviour, Hoax...

Crime Reduction Dashboards (October 2010)
Thu, 18 Nov 2010 14:13
The Crime Reduction Dashboards provide a visual indication of recorded crime figures against performance/reduction targets for the year-to-date. All seven districts of Leicestershire are covered along with Leicester City, and an overall view of Leicestershire and the Force Area. The local reduction targets...
Reducing Adult Reoffending
Wed, 17 Nov 2010 12:51
The report has been produced to help describe the adult offending and reoffending population of Leicester, Leicestershire and Rutland. Based on the demographics of individual offenders, characteristics of the communities in which offenders live and the criminogenic needs that these offenders, the report...

Partnership Strategic Assessment 2010-11
Mon, 15 Nov 2010 13:37
The Partnership Strategic Assessment for Leicester, Leicestershire and Rutland brings together information regarding crime, disorder and community safety from across partner agencies to identify the longer-term issues impacting on Leicester, Leicestershire and Rutland, as well as the scope of, and projections...

Crime Reduction Dashboards (September 2010)
Wed, 20 Oct 2010 14:02
The Crime Reduction Dashboards provide a visual indication of recorded crime figures against performance/reduction targets for the year-to-date. All seven districts of Leicestershire are covered along with Leicester City, and an overall view of Leicestershire and the Force Area. The local reduction targets...

Anti-Social Behaviour Dashboard (September 2010)
Wed, 20 Oct 2010 14:01
The Anti-Social Behaviour (ASB) Dashboard provides a visual indication of the number of recorded ASB incidents against the previous year-to-date targets and long-term average. ASB incidents are broken down by category: Rowdy or Inconsiderate Behaviour, Vehicle Nuisance and Inappropriate Behaviour, Hoax...

Crime Reduction Dashboards (August 2010)
Mon, 11 Oct 2010 07:37
The Crime Reduction Dashboards provide a visual indication of recorded crime figures against performance/reduction targets for the year-to-date. All seven districts of Leicestershire are covered along with Leicester City, and an overall view of Leicestershire and the Force Area. The local reduction targets...

Anti-Social Behaviour Dashboard (August 2010)
Mon, 11 Oct 2010 07:36
The Anti-Social Behaviour (ASB) Dashboard provides a visual indication of the number of recorded ASB incidents against the previous year-to-date targets and long-term average. ASB incidents are broken down by category: Rowdy or Inconsiderate Behaviour, Vehicle Nuisance and Inappropriate Behaviour, Hoax...

Anti-Social Behaviour Dashboard (July 2010)
Fri, 20 Aug 2010 13:53
The Anti-Social Behaviour (ASB) Dashboard provides a visual indication of the number of recorded ASB incidents against the previous year-to-date targets and long-term average. ASB incidents are broken down by category: Rowdy or Inconsiderate Behaviour, Vehicle Nuisance and Inappropriate Behaviour, Hoax...

Crime Reduction Dashboards (July 2010)
Fri, 20 Aug 2010 13:45
The Crime Reduction Dashboards provide a visual indication of recorded crime figures against performance/reduction targets for the year-to-date. All seven districts of Leicestershire are covered along with Leicester City, and an overall view of Leicestershire and the Force Area. The local reduction targets...

Housing Needs and Aspirations of Older People in Leicester and Leicestershire
Thu, 29 Jul 2010 14:35
This qualitative assessment research covers future housing needs and aspirations of older people from across the County and City of Leicester to inform the development of strategic services for this section of the population.
This work was commissioned by local authorites of the Leicester and Leicestershire...
Anti-Social Behaviour Dashboard (June 2010)
Tue, 20 Jul 2010 15:19
The Anti-Social Behaviour (ASB) Dashboard provides a visual indication of the number of recorded ASB incidents against the previous year-to-date targets and long-term average. ASB incidents are broken down by category: Rowdy or Inconsiderate Behaviour, Vehicle Nuisance and Inappropriate Behaviour, Hoax...
Crime Reduction Dashboards (June 2010)
Tue, 20 Jul 2010 15:14
The Crime Reduction Dashboards provide a visual indication of recorded crime figures against performance/reduction targets for the year-to-date. All seven districts of Leicestershire are covered along with Leicester City, and an overall view of Leicestershire and the Force Area. The local reduction targets...

Anti-Social Behaviour Dashboard (May 2010)
Wed, 30 Jun 2010 13:32
The Anti-Social Behaviour (ASB) Dashboard provides a visual indication of the number of recorded ASB incidents against the previous year-to-date targets and long-term average. ASB incidents are broken down by category: Rowdy or Inconsiderate Behaviour, Vehicle Nuisance and Inappropriate Behaviour, Hoax...

Crime Reduction Dashboards (May 2010)
Wed, 30 Jun 2010 13:25
The Crime Reduction Dashboards provide a visual indication of recorded crime figures against performance/reduction targets for the year-to-date. All seven districts of Leicestershire are covered along with Leicester City, and an overall view of Leicestershire and the Force Area. The local reduction targets...
NWL Place "Tracking" Survey Spring 2010
Tue, 08 Jun 2010 14:58
Following the first National Place Survey carried out in 2008, North West Leicestershire District Council commissioned NWA Social Research to conduct a 'tracking' survey to monitor changes in opinion since the 2008 survey. The principal objective of the tracking survey was to collect data to calculate...
Crime Reduction Dashboards (Year End 2009/10)
Thu, 15 Apr 2010 17:13
The Crime Reduction Dashboards provide a visual indication of recorded crime figures against performance/reduction targets for the year-to-date. All seven districts of Leicestershire are covered along with Leicester City, and an overall view of Leicestershire and the Force Area. The local reduction targets...

Anti-Social Behaviour Dashboard (Year End 2009/10)
Thu, 15 Apr 2010 17:11
The Anti-Social Behaviour (ASB) Dashboard provides a visual indication of the number of recorded ASB incidents against the previous year-to-date targets and long-term average. ASB incidents are broken down by category: Rowdy or Inconsiderate Behaviour, Vehicle Nuisance and Inappropriate Behaviour, Hoax...

Social Capital Survey Report 2010
Wed, 06 Jan 2010 15:57
As part of the Stronger Communities Block of the Leicestershire Local Area Agreement (LAA), the Communities and Voluntary Sector (CVS), DeMontfort University and Leicestershire County Council conducted a survey that attempted to baseline levels of social capital in 20 areas across Leicestershire. The...

Leicester and Leicestershire House Price and Sales Volume Monthly bulletin (October '09)
Mon, 28 Sep 2009 12:00
Using sales data, sourced from The Land Registry House Price Index (HPI), this report outlines house price and sales trends during a specified 12 month period. The HPI captures changes in the value of residential properties by analysing sales data collected on all residential housing transactions, whether...