Displaying 121 to 160 of 163

Crime Reduction Dashboards (November 2010)
Mon, 10 Jan 2011 14:50
The Crime Reduction Dashboards provide a visual indication of recorded crime figures against performance/reduction targets for the year-to-date. All seven districts of Leicestershire are covered along with Leicester City, and an overall view of Leicestershire and the Force Area. The local reduction targets...

Anti-Social Behaviour Dashboard (October 2010)
Thu, 18 Nov 2010 14:20
The Anti-Social Behaviour (ASB) Dashboard provides a visual indication of the number of recorded ASB incidents against the previous year-to-date targets and long-term average. ASB incidents are broken down by category: Rowdy or Inconsiderate Behaviour, Vehicle Nuisance and Inappropriate Behaviour, Hoax...

Crime Reduction Dashboards (October 2010)
Thu, 18 Nov 2010 14:13
The Crime Reduction Dashboards provide a visual indication of recorded crime figures against performance/reduction targets for the year-to-date. All seven districts of Leicestershire are covered along with Leicester City, and an overall view of Leicestershire and the Force Area. The local reduction targets...

Partnership Strategic Assessment 2010-11
Mon, 15 Nov 2010 13:37
The Partnership Strategic Assessment for Leicester, Leicestershire and Rutland brings together information regarding crime, disorder and community safety from across partner agencies to identify the longer-term issues impacting on Leicester, Leicestershire and Rutland, as well as the scope of, and projections...

Crime Reduction Dashboards (September 2010)
Wed, 20 Oct 2010 14:02
The Crime Reduction Dashboards provide a visual indication of recorded crime figures against performance/reduction targets for the year-to-date. All seven districts of Leicestershire are covered along with Leicester City, and an overall view of Leicestershire and the Force Area. The local reduction targets...

Anti-Social Behaviour Dashboard (September 2010)
Wed, 20 Oct 2010 14:01
The Anti-Social Behaviour (ASB) Dashboard provides a visual indication of the number of recorded ASB incidents against the previous year-to-date targets and long-term average. ASB incidents are broken down by category: Rowdy or Inconsiderate Behaviour, Vehicle Nuisance and Inappropriate Behaviour, Hoax...

Crime Reduction Dashboards (August 2010)
Mon, 11 Oct 2010 07:37
The Crime Reduction Dashboards provide a visual indication of recorded crime figures against performance/reduction targets for the year-to-date. All seven districts of Leicestershire are covered along with Leicester City, and an overall view of Leicestershire and the Force Area. The local reduction targets...

Anti-Social Behaviour Dashboard (August 2010)
Mon, 11 Oct 2010 07:36
The Anti-Social Behaviour (ASB) Dashboard provides a visual indication of the number of recorded ASB incidents against the previous year-to-date targets and long-term average. ASB incidents are broken down by category: Rowdy or Inconsiderate Behaviour, Vehicle Nuisance and Inappropriate Behaviour, Hoax...

Anti-Social Behaviour Dashboard (July 2010)
Fri, 20 Aug 2010 13:53
The Anti-Social Behaviour (ASB) Dashboard provides a visual indication of the number of recorded ASB incidents against the previous year-to-date targets and long-term average. ASB incidents are broken down by category: Rowdy or Inconsiderate Behaviour, Vehicle Nuisance and Inappropriate Behaviour, Hoax...

Crime Reduction Dashboards (July 2010)
Fri, 20 Aug 2010 13:45
The Crime Reduction Dashboards provide a visual indication of recorded crime figures against performance/reduction targets for the year-to-date. All seven districts of Leicestershire are covered along with Leicester City, and an overall view of Leicestershire and the Force Area. The local reduction targets...
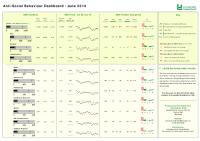
Anti-Social Behaviour Dashboard (June 2010)
Tue, 20 Jul 2010 15:19
The Anti-Social Behaviour (ASB) Dashboard provides a visual indication of the number of recorded ASB incidents against the previous year-to-date targets and long-term average. ASB incidents are broken down by category: Rowdy or Inconsiderate Behaviour, Vehicle Nuisance and Inappropriate Behaviour, Hoax...
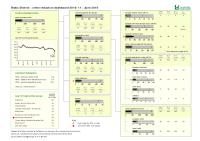
Crime Reduction Dashboards (June 2010)
Tue, 20 Jul 2010 15:14
The Crime Reduction Dashboards provide a visual indication of recorded crime figures against performance/reduction targets for the year-to-date. All seven districts of Leicestershire are covered along with Leicester City, and an overall view of Leicestershire and the Force Area. The local reduction targets...

Anti-Social Behaviour Dashboard (May 2010)
Wed, 30 Jun 2010 13:32
The Anti-Social Behaviour (ASB) Dashboard provides a visual indication of the number of recorded ASB incidents against the previous year-to-date targets and long-term average. ASB incidents are broken down by category: Rowdy or Inconsiderate Behaviour, Vehicle Nuisance and Inappropriate Behaviour, Hoax...

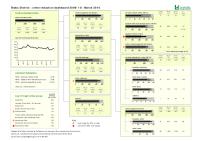
Crime Reduction Dashboards (May 2010)
Wed, 30 Jun 2010 13:25
The Crime Reduction Dashboards provide a visual indication of recorded crime figures against performance/reduction targets for the year-to-date. All seven districts of Leicestershire are covered along with Leicester City, and an overall view of Leicestershire and the Force Area. The local reduction targets...
Crime Reduction Dashboards (Year End 2009/10)
Thu, 15 Apr 2010 17:13
The Crime Reduction Dashboards provide a visual indication of recorded crime figures against performance/reduction targets for the year-to-date. All seven districts of Leicestershire are covered along with Leicester City, and an overall view of Leicestershire and the Force Area. The local reduction targets...

Anti-Social Behaviour Dashboard (Year End 2009/10)
Thu, 15 Apr 2010 17:11
The Anti-Social Behaviour (ASB) Dashboard provides a visual indication of the number of recorded ASB incidents against the previous year-to-date targets and long-term average. ASB incidents are broken down by category: Rowdy or Inconsiderate Behaviour, Vehicle Nuisance and Inappropriate Behaviour, Hoax...

Leicester and Leicestershire House Price and Sales Volume Monthly bulletin (October '09)
Mon, 28 Sep 2009 12:00
Using sales data, sourced from The Land Registry House Price Index (HPI), this report outlines house price and sales trends during a specified 12 month period. The HPI captures changes in the value of residential properties by analysing sales data collected on all residential housing transactions, whether...

Leicestershire Community Safety Partnership Strategic Assessment 2009
Wed, 23 Sep 2009 11:31
The Partnership Strategic Assessment provides a summary of the crime, disorder and substance misuse issues across Leicestershire during 2008/09. The information within this assessment is designed to aid the Leicestershire Safer Communities Strategy Board to review current and develop future strategic...

Crime Reduction Dashboards (Year End 2008/9)
Mon, 08 Jun 2009 10:36
The Crime Reduction Dashboards provide a visual indication of recorded crime figures against performance/reduction targets. All seven districts of Leicestershire are covered along with Leicester City, and an overall view of Leicestershire and the Force Area.
For more information, please contact:
Karen...

Market Harborough Priority Neighbourhood Profile
Wed, 27 May 2009 13:52
The Market Harborough Priority Neighbourhood Profile for Central Market Harborough is now available. This profile provides a comprehensive overview of the Market Harborough intervention and monitoring areas. The report covers a range of useful baseline statistics for the area including information on...

Leicester and Leicestershire House Price by Household Type (Jan 08 - Jan 09)
Mon, 23 Mar 2009 15:00
Using sales data sourced from The Land Registry House Price Index this report showcases trends for the 12 calendar months prior to January 2009. The HPI captures changes in the value of residential properties by analysing sales data collected on all residential housing transactions, whether for cash...

Social Capital Survey 2007
Wed, 11 Feb 2009 15:58
As part of the Stronger Communities Block of the Leicestershire Local Area Agreement (LAA), the Communities and Voluntary Sector (CVS), DeMontfort University and Leicestershire County Council conducted a survey that attempted to baseline levels of social capital in 20 areas across Leicestershire.
Social...
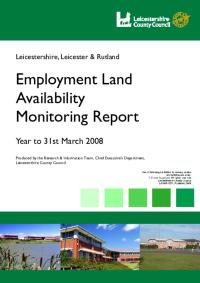
Employment Land Availability Report 2008
Tue, 09 Dec 2008 11:50
The Annual Employment Land Availability Report contains information on employment land supply, availability and development in Leicester, Leicestershire and Rutland. The latest report, covering the year to 31st March 2008, has been published. Land availability and development are measured against the...

Residential Land Availability Report 2008
Tue, 09 Dec 2008 11:46
The Annual Residential Land Availability Report contains information on residential land supply, availability and development in Leicester, Leicestershire and Rutland. The latest report, covering the year to 31st March 2008, has been published. Land availability and development are measured against the...

Leicestershire Community Safety : Evidence Base Summary 2008
Tue, 02 Dec 2008 13:59
This Community Safety Partnership Evidence Base Summary summarises the findings of the Leicestershire Community Safety Partnership Strategic Assessment 2008 for the Leicestershire County.

Leicestershire Community Safety Partnership Strategic Assessment 2008
Tue, 02 Dec 2008 13:59
The purpose of this Evidence-Base document is to provide Community Safety Partnerships within Leicestershire with a comprehensive, robust and accurate picture of crime and disorder issues across the county. This Evidence-Base report provides the fundamental information to form the basis of the Partnership...

Harborough Community Safety Partnership : Evidence Base Summary 2008
Tue, 02 Dec 2008 13:40
This Community Safety Partnership Evidence Base Summary summarises the findings of the Leicestershire Community Safety Partnership Strategic Assessment 2008 for the Harborough Community Safety Partnership.
For more information, please contact:
Karen Earp
Research and Insight Officer
Research and Insight...

2001 Census Output Area Classifications
Fri, 03 Oct 2008 14:52
The 2001 Area Classifications were created on behalf of the Office of National Statistics by the University of Leeds. The classification is used to group together geographic areas according to key characteristics common to the population in that grouping. These groupings are called clusters, and are...

Deprivation Change in Leicestershire Priority Neighbourhoods
Tue, 10 Jun 2008 09:37
This report examines the change in IMD (Indices of Multiple Deprivation) ranking between 2004 and 2007 within LAA Priority Neighbourhoods. The document provides an outline to the process of identifying Priority Neighbourhoods and the role played by IMD in the initial work as well as an overview of the...

Leicestershire, Leicester and Rutland Employment Land Availability Report 2006-07
Wed, 30 Jan 2008 08:58
The Annual Employment Land Availability Report contains information on employment land supply, availability and development in Leicester, Leicestershire and Rutland. The latest report, covering the year to 31st March 2007, has been published. Land availability and development are measured against the...

Leicestershire, Leicester and Rutland Residential Land Availability Report 2006-07
Tue, 29 Jan 2008 16:25
The Annual Residential Land Availability Report contains information on residential land supply, availability and development in Leicester, Leicestershire and Rutland. The latest report, covering the year to 31st March 2007, has been published. Land availability and development are measured against the...

Harborough CSP Strategic Assessment 2007
Fri, 18 Jan 2008 16:31
The Partnership Strategic Assessment provides knowledge and understanding of community safety problems that will inform and enable partners to develop their Community Safety Plan 2008-11

Places in Leicestershire Reports 2007
Fri, 14 Dec 2007 18:40
The Places in Leicestershire reports identify and highlight the priorities for individual places in Leicestershire, based on relevant and available data sources and information. The reports form part of the evidence base for the 2008 Leicestershire Sustainable Community Strategy, enabling identification...

Active People KPI1 small area estimates for Harborough
Mon, 10 Dec 2007 14:21
The Active People Survey is the largest ever survey of sport and active recreation to be undertaken by Sport England in Europe. Key Performance Indicator (KPI) #1 is the numbers of people participating moderately in physical activity for thirty minutes three times a week. This thematic map of the Harborough...

Indices of Deprivation 2004 - Key Findings
Thu, 01 Nov 2007
The Indices of Deprivation 2004 are produced by the Office of the Deputy Prime Minister (ODPM). They are an attempt to measure deprivation in a consistent way for small areas across England. The following documents cover the individual districts of Leicestershire and Leicestershire county as a whole....

Economic Baseline Study 2006 - District Profiles
Thu, 07 Dec 2006 09:59
The 2006 Leicester Shire Economic Baseline Study provides a comprehensive review of the County economy including chapters based around the economy and investment, people, labour market and skills and the Local Economy Audit Model carried out by Ecotec Research and Consulting.
These separate documents...
Economic Baseline Study 2006 - Harborough
Thu, 07 Dec 2006 09:40
The 2006 Leicester Shire Economic Baseline Study provides a comprehensive review of the sub-regional economy including chapters based around the economy and investment, people, labour market and skills and the Local Economy Audit Model carried out by Ecotec Research and Consulting.
This document provides...

District Community Profiles 2005
Wed, 01 Nov 2006
These community profiles for the seven districts contains a range of data from a variety of sources and considers all aspects of the local community. They include chapters on crime, health, ethnicity, deprivation, education and the local economy.

Travel to Work - District Profiles
Wed, 01 Feb 2006 11:49
These reports provide travel to work data and analysis for people between the ages of 16 to 74 in employment who live in a particular districtborough as well as those that work inside that disrtictborough. It is therefore concerned with the resident and workplace population in employment between the...

District Area Profiles - Census 2001 Key Statistics
Sun, 01 Jan 2006
The 24 tables cover the main Census topics and consist of approximately 375 counts. These tables are resently available only at local authority district,county, unitary, regional and national level. These area profiles provides a summary of key data for Leicestershire Districts,County, East Midlands...