Displaying 201 to 240 of 616

Anti-Social Behaviour Dashboard (Year End 2009/10)
Thu, 15 Apr 2010 17:11
The Anti-Social Behaviour (ASB) Dashboard provides a visual indication of the number of recorded ASB incidents against the previous year-to-date targets and long-term average. ASB incidents are broken down by category: Rowdy or Inconsiderate Behaviour, Vehicle Nuisance and Inappropriate Behaviour, Hoax...
Crime Reduction Dashboards (Year End 2009/10)
Thu, 15 Apr 2010 17:13
The Crime Reduction Dashboards provide a visual indication of recorded crime figures against performance/reduction targets for the year-to-date. All seven districts of Leicestershire are covered along with Leicester City, and an overall view of Leicestershire and the Force Area. The local reduction targets...

Leicester and Leicestershire Business Survey 2009/2010
Mon, 19 Apr 2010 10:08
The Leicester and Leicestershire Business Survey has been carried out by a partnership involving Leicestershire County Council, Leicester City Council and other key local agencies over the last 10 years. The survey provides a comprehensive picture of local business optimism and performance. Interviews...

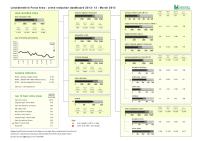
Unemployment Bulletin March 2010
Wed, 21 Apr 2010
The monthly Unemployment Bulletin provides data on number and rate of Job Seekers Allowance (JSA) claimants across Leicester Shire.
The JSA claimant data in this bulletin is available down to ward level. The JSA data is also available broken down by the detailed ethnic groups down to Local Authority level....
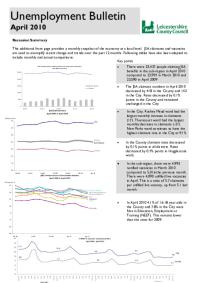
Unemployment Bulletin April 2010
Wed, 12 May 2010
The monthly Unemployment Bulletin provides data on number and rate of Job Seekers Allowance (JSA) claimants across Leicester Shire.
The JSA claimant data in this bulletin is available down to ward level. The JSA data is also available broken down by the detailed ethnic groups down to Local Authority level....

Places in Leicestershire Reports 2007
Fri, 14 Dec 2007 18:40
The Places in Leicestershire reports identify and highlight the priorities for individual places in Leicestershire, based on relevant and available data sources and information. The reports form part of the evidence base for the 2008 Leicestershire Sustainable Community Strategy, enabling identification...

Leicester and Leicestershire Economic Assessment
Fri, 28 May 2010 17:20
Economic Assessment (EA)
Background
The Local Democracy, Economic Development and Construction Act 2009 placed a duty on county councils and unitary district councils to prepare an economic assessment of the economic conditions of their area. This new duty came into force on 1st April 2010, at which point...
NWL Place "Tracking" Survey Spring 2010
Tue, 08 Jun 2010 14:58
Following the first National Place Survey carried out in 2008, North West Leicestershire District Council commissioned NWA Social Research to conduct a 'tracking' survey to monitor changes in opinion since the 2008 survey. The principal objective of the tracking survey was to collect data to calculate...

Unemployment Bulletin May 2010
Wed, 16 Jun 2010
The monthly Unemployment Bulletin provides data on number and rate of Job Seekers Allowance (JSA) claimants across Leicester Shire.
The JSA claimant data in this bulletin is available down to ward level. The JSA data is also available broken down by the detailed ethnic groups down to Local Authority level....

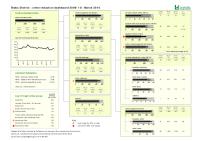
Blaby Electoral Division Profiles - Census 2001 Key Statistics
Mon, 31 Jan 2005 15:45
Following the recent boundary changes in Leicestershire these area profiles provides a summary of the key data for each of the eight Electoral Divisions in Blaby, using the 2001 Census.

Crime Reduction Dashboards (May 2010)
Wed, 30 Jun 2010 13:25
The Crime Reduction Dashboards provide a visual indication of recorded crime figures against performance/reduction targets for the year-to-date. All seven districts of Leicestershire are covered along with Leicester City, and an overall view of Leicestershire and the Force Area. The local reduction targets...

Domestic Abuse Dashboard: Quarter 3 - 2012/13
Fri, 01 Feb 2013 10:29
The Domestic Abuse Dashboard provides a visual indication of recorded offences and non-recordable incidents of domestic abuse reported to the Police in Leicestershire County for the current year-to-date compared to the same period last year. Figures are provided for all seven districts of Leicestershire....

Community Based Survey Results 2012/13 Q3
Fri, 01 Feb 2013 14:17
Leicestershire County Council and Leicestershire Police Authority have jointly commissioned the Community Based Survey, which replaces the previous community safety CRAVE Survey. The project combines key survey requirements of the County Council and Police Authority together into one consultation. As...

Community Based Survey Results 2012/13 Q2
Fri, 01 Feb 2013 14:24
Leicestershire County Council and Leicestershire Police Authority have jointly commissioned the Community Based Survey, which replaces the previous community safety CRAVE Survey. The project combines key survey requirements of the County Council and Police Authority together into one consultation. As...

Safer North West Partnership Strategic Assessment - September 2012
Mon, 04 Feb 2013 10:19
The Partnership Strategic Assessment for North West Leicestershire brings together information regarding crime, disorder and community safety from across partner agencies to identify the longer-term issues impacting in North West Leicestershire as well as the scope of, and projections for crime, criminality...

Census 2011 - Open Atlas Project - Key Statistics information for districts
Tue, 12 Feb 2013 08:50
Alex Singleton, Lecturer in Geography at the University of Liverpool has mapped every Census Key Statistic at output area (OA) level for every local authority in England and Wales.
"Almost every non count variable (apart from Hectares) was mapped from the Key Statistics data disseminated by Nomis, and...

Unemployment Bulletin January 2013
Wed, 20 Feb 2013
The JSA claimant data in this bulletin is available down to ward level. The JSA data is also available broken down by the detailed ethnic groups down to Local Authority level.
The population figures used to calculate residence-based proportions (rates) have changed from working age (16-59f/64m) to aged...

Forecast Social Return on Investment (SROI) of supporting the Community Meals Service in Leicestershire
Wed, 20 Feb 2013 15:58
The aim of this report is to use the principles of Social Return on Investment (SROI) to forecast the value of Leicestershire County Council's contract with the Community Meals Service in Leicestershire. The Community Meals Service provides hot meals to elderly residents in Leicestershire 365 days a...

Social Return on Investment (SROI) Evaluation of the Leicestershire and Rutland Community Safer Sex Project
Wed, 20 Feb 2013 16:18
This report uses the Social Return on Investment (SROI) methodology to explore the value of the Community Safer Sex Project (CSSP) in terms of who is affected by the project and what changes for them. The Community Safer Sex Project (CSSP) was established in 2001 to support the emerging Teenage Pregnancy...

Social Return on Investment (SROI) Evaluation of Twenty Twenty Mentoring Scheme
Wed, 20 Feb 2013 16:28
The aim of this evaluation is to use the principles of Social Return on Investment (SROI) to evaluate the value of the Leicestershire Twenty Twenty scheme.Twenty Twenty is a charity that specialises in education and support for disadvantaged young people in Leicestershire between the ages of 11 and 18.The...

Crime Reduction Dashboards (January 2013)
Tue, 05 Mar 2013 14:16
The Crime Reduction Dashboards provide a visual indication of recorded crime figures against performance/reduction targets for the year-to-date. All seven districts of Leicestershire are covered along with Leicester City, and an overall view of Leicestershire and the Force Area.
For more information,...

Anti-Social Behaviour Dashboard (January 2013)
Tue, 05 Mar 2013 14:18
The Anti-Social Behaviour (ASB) Dashboard provides a visual indication of the number of recorded ASB incidents against the previous year-to-date and long-term average. ASB incidents are broken down into three categories: personal, nuisance and environmental. All seven districts of Leicestershire are...

Unemployment Bulletin February 2013
Wed, 20 Mar 2013
The JSA claimant data in this bulletin is available down to ward level. The JSA data is also available broken down by the detailed ethnic groups down to Local Authority level.
The population figures used to calculate residence-based proportions (rates) have changed from working age (16-59f/64m) to aged...

Hinckley & Bosworth Community Safety Partnership Strategic Assessment - September 2012
Fri, 05 Apr 2013 10:22
The Partnership Strategic Assessment for Hinckley & Bosworth brings together information regarding crime, disorder and community safety from across partner agencies to identify the longer-term issues impacting within Hinckley & Bosworth as well as the scope of, and projections for crime, criminality...

Charnwood Community Safety Partnership Strategic Assessment - September 2012
Fri, 05 Apr 2013 10:30
The Partnership Strategic Assessment for Charnwood brings together information regarding crime, disorder and community safety from across partner agencies to identify the longer-term issues impacting within Charnwood Borough as well as the scope of, and projections for crime, criminality and other community...

Anti-Social Behaviour Dashboard (February 2013)
Fri, 05 Apr 2013 13:57
The Anti-Social Behaviour (ASB) Dashboard provides a visual indication of the number of recorded ASB incidents against the previous year-to-date and long-term average. ASB incidents are broken down into three categories: personal, nuisance and environmental. All seven districts of Leicestershire are...

Crime Reduction Dashboards (February 2013)
Fri, 05 Apr 2013 13:58
The Crime Reduction Dashboards provide a visual indication of recorded crime figures against performance/reduction targets for the year-to-date. All seven districts of Leicestershire are covered along with Leicester City, and an overall view of Leicestershire and the Force Area.
For more information,...

Unemployment Bulletin March 2013
Thu, 18 Apr 2013
The JSA claimant data in this bulletin is available down to ward level. The JSA data is also available broken down by the detailed ethnic groups down to Local Authority level.
The population figures used to calculate residence-based proportions (rates) have changed from working age (16-59f/64m) to aged...

Mortality reports
Tue, 30 Apr 2013 15:37
Reports on the four most common causes of death (Cancer, Cardio Vascular Disease, Liver Disease and Respiratory Disease) for Leicestershire and Rutland. Describing trends, also benchmarking against similar areas in England
Crime Reduction Dashboards (March 2013)
Thu, 02 May 2013 14:21
The Crime Reduction Dashboards provide a visual indication of recorded crime figures against performance/reduction targets for the year-to-date. All seven districts of Leicestershire are covered along with Leicester City, and an overall view of Leicestershire and the Force Area.
For more information,...

Anti-Social Behaviour Dashboard (March 2013)
Thu, 02 May 2013 14:29
The Anti-Social Behaviour (ASB) Dashboard provides a visual indication of the number of recorded ASB incidents against the previous year-to-date and long-term average. ASB incidents are broken down into three categories: personal, nuisance and environmental. All seven districts of Leicestershire are...

Domestic Abuse Dashboard: Quarter 4 - 2012/13
Thu, 02 May 2013 14:31
Domestic Abuse data is now available as an interactive dashboard in tableau available here.
A PDF version can be downloaded below.
The Domestic Abuse Dashboard provides a visual indication of recorded offences and non-recordable incidents of domestic abuse reported to the Police in Leicestershire County...

Hate Incident Monitoring Project Dashboard: Quarter 4 – 2012/13
Thu, 02 May 2013 14:42
The Hate Incident Monitoring Project Dashboard provides a quarterly summary of the number of hate incidents reported to the Police, HIMP and in schools. Performance information is available for Leicestershire and each of the seven district Community Safety Partnerships. The reverse of the dashboard shows...
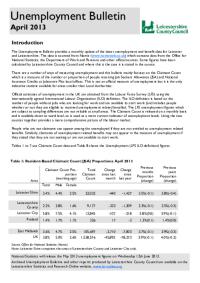
Unemployment Bulletin April 2013
Wed, 15 May 2013
The JSA claimant data in this bulletin is available down to ward level. The JSA data is also available broken down by the detailed ethnic groups down to Local Authority level.
The population figures used to calculate residence-based proportions (rates) have changed from working age (16-59f/64m) to aged...

Anti-Social Behaviour Dashboard (April 2013)
Tue, 21 May 2013 12:20
The Anti-Social Behaviour (ASB) data is now available as a fully interactive dashboard in tableau available here.
(N.B. You will need Internet Explorer 8 or above, Google Chrome or latest Firefox to view the dashboard)
A PDF version can be downloaded below.
The ASB Dashboard compares the rolling year- to-date...

Oadby & Wigston Electoral Divisions - 2011 Census Key Stats
Wed, 29 May 2013 15:11
These reports provide a broad overview of the 2011 Census Key Statistics data, released by the Office for National Statistics on 30th January 2013, as part of the Census Second Release. The reports summarise a selection of key headline datasets of this release for Leicestershire Electoral Divisions (EDs)....

North West Leicestershire Electoral Divisions - 2011 Census Key Stats
Wed, 29 May 2013 15:17
These reports provide a broad overview of the 2011 Census Key Statistics data, released by the Office for National Statistics on 30th January 2013, as part of the Census Second Release. The reports summarise a selection of key headline datasets of this release for Leicestershire Electoral Divisions (EDs)....
Melton Electoral Divisions - 2011 Census Key Stats
Wed, 29 May 2013 15:18
These reports provide a broad overview of the 2011 Census Key Statistics data, released by the Office for National Statistics on 30th January 2013, as part of the Census Second Release. The reports summarise a selection of key headline datasets of this release for Leicestershire Electoral Divisions (EDs)....

Hinckley & Bosworth Electoral Divisions - 2011 Census Key Stats
Wed, 29 May 2013 15:18
These reports provide a broad overview of the 2011 Census Key Statistics data, released by the Office for National Statistics on 30th January 2013, as part of the Census Second Release. The reports summarise a selection of key headline datasets of this release for Leicestershire Electoral Divisions (EDs)....