Displaying 121 to 160 of 170

The second phase of the 2011 Census Second Release was released on December 11th. This release includes a range of socio-economic data at national, regional and local authority level. This report summarises the key findings of this release for Leicestershire by the following broad themes:
- Age, Sex and...

Census 2011 - LSOA population by sex and five year age bands
Mon, 18 Feb 2013 14:25
Leicestershire County Council
The following interactive dashboard contains information on population for Leicestershire Lower Super Output Areas (LSOAs).
Census 2011 LSOA population dashboard by sex and quinary age (N.B. requires Internet Explorer 8 and above or comparable browser).
LSOAs are small units of geography (containing, on...
Census 2011 - Open Atlas Project - Key Statistics information for districts
Tue, 12 Feb 2013 08:50
Alex Singleton, Lecturer in Geography at the University of Liverpool has mapped every Census Key Statistic at output area (OA) level for every local authority in England and Wales.
"Almost every non count variable (apart from Hectares) was mapped from the Key Statistics data disseminated by Nomis, and...

Community Based Survey Results 2012/13 Q3
Fri, 01 Feb 2013 14:17
Leicestershire County Council and Leicestershire Police Authority have jointly commissioned the Community Based Survey, which replaces the previous community safety CRAVE Survey. The project combines key survey requirements of the County Council and Police Authority together into one consultation. As...

Domestic Abuse Dashboard: Quarter 3 - 2012/13
Fri, 01 Feb 2013 10:29
The Domestic Abuse Dashboard provides a visual indication of recorded offences and non-recordable incidents of domestic abuse reported to the Police in Leicestershire County for the current year-to-date compared to the same period last year. Figures are provided for all seven districts of Leicestershire....

Crime Reduction Dashboards (December 2012)
Thu, 31 Jan 2013 10:25
The Crime Reduction Dashboards provide a visual indication of recorded crime figures against performance/reduction targets for the year-to-date. All seven districts of Leicestershire are covered along with Leicester City, and an overall view of Leicestershire and the Force Area.
For more information,...

Anti-Social Behaviour Dashboard (Dec 2012)
Thu, 31 Jan 2013 10:21
The Anti-Social Behaviour (ASB) Dashboard provides a visual indication of the number of recorded ASB incidents against the previous year-to-date and long-term average. ASB incidents are broken down into three categories: personal, nuisance and environmental. All seven districts of Leicestershire are...

Anti-Social Behaviour Dashboard (Nov 2012)
Thu, 31 Jan 2013 10:14
The Anti-Social Behaviour (ASB) Dashboard provides a visual indication of the number of recorded ASB incidents against the previous year-to-date and long-term average. ASB incidents are broken down into three categories: personal, nuisance and environmental. All seven districts of Leicestershire are...

Anti-Social Behaviour Dashboard (Oct 2012)
Thu, 31 Jan 2013 10:12
The Anti-Social Behaviour (ASB) Dashboard provides a visual indication of the number of recorded ASB incidents against the previous year-to-date and long-term average. ASB incidents are broken down into three categories: personal, nuisance and environmental. All seven districts of Leicestershire are...

Unemployment Bulletin December 2012
Wed, 23 Jan 2013
The JSA claimant data in this bulletin is available down to ward level. The JSA data is also available broken down by the detailed ethnic groups down to Local Authority level.
The population figures used to calculate residence-based proportions (rates) have changed from working age (16-59f/64m) to aged...

Unemployment Bulletin November 2012
Wed, 12 Dec 2012
The JSA claimant data in this bulletin is available down to ward level. The JSA data is also available broken down by the detailed ethnic groups down to Local Authority level.
The population figures used to calculate residence-based proportions (rates) have changed from working age (16-59f/64m) to aged...

Unemployment Bulletin October 2012
Wed, 14 Nov 2012
The JSA claimant data in this bulletin is available down to ward level. The JSA data is also available broken down by the detailed ethnic groups down to Local Authority level.
The population figures used to calculate residence-based proportions (rates) have changed from working age (16-59f/64m) to aged...

Crime Reduction Dashboards (September 2012)
Mon, 22 Oct 2012 09:45
The Crime Reduction Dashboards provide a visual indication of recorded crime figures against performance/reduction targets for the year-to-date. All seven districts of Leicestershire are covered along with Leicester City, and an overall view of Leicestershire and the Force Area.
For more information,...

Crime Reduction Dashboards (August 2012)
Mon, 22 Oct 2012 09:37
The Crime Reduction Dashboards provide a visual indication of recorded crime figures against performance/reduction targets for the year-to-date. All seven districts of Leicestershire are covered along with Leicester City, and an overall view of Leicestershire and the Force Area.
For more information,...
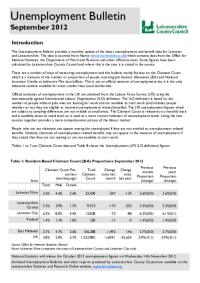
Unemployment Bulletin September 2012
Wed, 17 Oct 2012
The JSA claimant data in this bulletin is available down to ward level. The JSA data is also available broken down by the detailed ethnic groups down to Local Authority level.
The population figures used to calculate residence-based proportions (rates) have changed from working age (16-59f/64m) to aged...

Unemployment Bulletin August 2012
Wed, 12 Sep 2012
The JSA claimant data in this bulletin is available down to ward level. The JSA data is also available broken down by the detailed ethnic groups down to Local Authority level.
The population figures used to calculate residence-based proportions (rates) have changed from working age (16-59f/64m) to aged...

Crime Reduction Dashboards (July 2012)
Fri, 31 Aug 2012 11:45
The Crime Reduction Dashboards provide a visual indication of recorded crime figures against performance/reduction targets for the year-to-date. All seven districts of Leicestershire are covered along with Leicester City, and an overall view of Leicestershire and the Force Area.
For more information,...
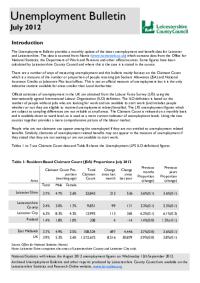
Unemployment Bulletin July 2012
Wed, 29 Aug 2012
The JSA claimant data in this bulletin is available down to ward level. The JSA data is also available broken down by the detailed ethnic groups down to Local Authority level.
The population figures used to calculate residence-based proportions (rates) have changed from working age (16-59f/64m) to aged...

Crime Reduction Dashboards (June 2012)
Mon, 30 Jul 2012 15:28
The Crime Reduction Dashboards provide a visual indication of recorded crime figures against performance/reduction targets for the year-to-date. All seven districts of Leicestershire are covered along with Leicester City, and an overall view of Leicestershire and the Force Area.
For more information,...

Census 2011 - First Release
Mon, 23 Jul 2012 13:01
On 16th July 2012 the Office of National Statistics published the first of four Census releases. This first release contains detail on:
• Sex and age (at 5 year bands) of the population
• Number of households
• Population estimates (residents and those living in communal establishments)...

Crime Reduction Dashboards (May 2012)
Fri, 22 Jun 2012 11:07
The Crime Reduction Dashboards provide a visual indication of recorded crime figures against performance/reduction targets for the year-to-date. All seven districts of Leicestershire are covered along with Leicester City, and an overall view of Leicestershire and the Force Area.
For more information,...

Crime Reduction Dashboards (April 2012)
Mon, 11 Jun 2012 16:03
The Crime Reduction Dashboards provide a visual indication of recorded crime figures against performance/reduction targets for the year-to-date. All seven districts of Leicestershire are covered along with Leicester City, and an overall view of Leicestershire and the Force Area.
For more information,...

Crime Reduction Dashboards (March 2012)
Thu, 03 May 2012 13:03
The Crime Reduction Dashboards provide a visual indication of recorded crime figures against performance/reduction targets for the year-to-date. All seven districts of Leicestershire are covered along with Leicester City, and an overall view of Leicestershire and the Force Area.
For more information,...

Crime Reduction Dashboards (February 2012)
Wed, 11 Apr 2012 09:10
The Crime Reduction Dashboards provide a visual indication of recorded crime figures against performance/reduction targets for the year-to-date. All seven districts of Leicestershire are covered along with Leicester City, and an overall view of Leicestershire and the Force Area.
For more information,...

Crime Reduction Dashboards (January 2012)
Fri, 24 Feb 2012 11:09
The Crime Reduction Dashboards provide a visual indication of recorded crime figures against performance/reduction targets for the year-to-date. All seven districts of Leicestershire are covered along with Leicester City, and an overall view of Leicestershire and the Force Area.
For more information,...

Hate Incident Monitoring Project Dashboard
Tue, 22 Nov 2011 14:11
The Hate Incident Monitoring Project Dashboard provides a quarterly summary of the number of hate incidents reported to the Police and to the HIMP (and Leicestershire Schools - Quarter 4 only). The dashboard provides an indication of the progress towards the target to increase the reporting of hate incidents...

Overseas migrant worker inflows to 2010
Thu, 11 Aug 2011 17:58
New registrations for National Insurance numbers by overseas nationals give an indication of the number of overseas workers in residence here for more than a year. The total number registering from January to December 2010 was over 7,000 in Leicester City and over 2,000 in Leicestershire County. The...

Population Estimates Trends Updated to 2010
Tue, 02 Aug 2011 10:28
The Office for National Statistics (ONS) estimate of the mid-2010 population for Leicestershire is 648,700, and Leicester 306,600, with the Leicestershire and Leicester sub-region about 955,400 in estimated population. Office for National Statistics (ONS) published mid-2010 population estimates on 30th...

District Community Profiles 2005
Wed, 01 Nov 2006
These community profiles for the seven districts contains a range of data from a variety of sources and considers all aspects of the local community. They include chapters on crime, health, ethnicity, deprivation, education and the local economy.

District Area Profiles - Census 2001 Key Statistics
Sun, 01 Jan 2006
The 24 tables cover the main Census topics and consist of approximately 375 counts. These tables are resently available only at local authority district,county, unitary, regional and national level. These area profiles provides a summary of key data for Leicestershire Districts,County, East Midlands...

Blaby Ward Profiles - Census 2001
Mon, 31 Jan 2005 15:45
1)The profiles below provide a summary of all the main Census topics for each ward in the District. The profiles have been compiled using the Key Statistics Tables series released by the Office of National Statistics in 2003 and also provide comparison figures for the District and County areas.
Please...
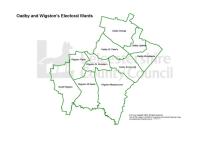
Oadby & Wigston Ward Profiles - Census 2001
Mon, 31 Jan 2005 15:45
1)The profiles below provide a summary of all the main Census topics for each ward in the District. The profiles have been compiled using the Key Statistics Tables series released by the Office of National Statistics in 2003 and also provide comparison figures for the District and County areas.
Please...

North West Leicestershire Ward Profiles - Census 2001
Mon, 31 Jan 2005 15:45
1)The profiles below provide a summary of all the main Census topics for each ward in the District. The profiles have been compiled using the Key Statistics Tables series released by the Office of National Statistics in 2003 and also provide comparison figures for the District and County areas.
Please...

Melton Ward Profiles - Census 2001
Mon, 31 Jan 2005 15:45
1)The profiles below provide a summary of all the main Census topics for each ward in the District. The profiles have been compiled using the Key Statistics Tables series released by the Office of National Statistics in 2003 and also provide comparison figures for the District and County areas.
Please...

Hinckley & Bosworth Ward Profiles - Census 2001
Mon, 31 Jan 2005 15:45
1)The profiles below provide a summary of all the main Census topics for each ward in the District. The profiles have been compiled using the Key Statistics Tables series released by the Office of National Statistics in 2003 and also provide comparison figures for the District and County areas.
Please...

Harborough Ward Profiles - Census 2001
Mon, 31 Jan 2005 15:45
1)The profiles below provide a summary of all the main Census topics for each ward in the District. The profiles have been compiled using the Key Statistics Tables series released by the Office of National Statistics in 2003 and also provide comparison figures for the District and County areas.
Please...

Charnwood Ward Profiles - Census 2001
Mon, 31 Jan 2005 15:45
1)The profiles below provide a summary of all the main Census topics for each ward in the District. The profiles have been compiled using the Key Statistics Tables series released by the Office of National Statistics in 2003 and also provide comparison figures for the District and County areas.
Please...

Oadby & Wigston Electoral Division Profiles - Census 2001 Key Statistics
Mon, 31 Jan 2005 15:45
Following the recent boundary changes in Leicestershire these area profiles provides a summary of the key data for the four Oadby & Wigston Electoral Divisions, using the 2001 Census.

NW Leicestershire Electoral Division Profiles - Census 2001 Key Statistics
Mon, 31 Jan 2005 15:45
Following the recent boundary changes in Leicestershire, these area profiles provides a summary of the key data for an Electoral Division using the 2001 Census.

Melton Electoral Division Profiles - Census 2001 Key Statistics
Mon, 31 Jan 2005 15:45
Following the recent boundary changes in Leicestershire, these area profiles provides a summary of the key data for an Electoral Division using the 2001 Census.