Displaying 1 to 40 of 254
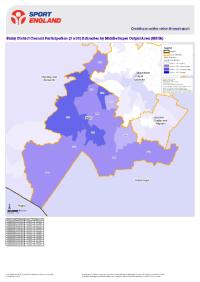
Active People KPI1 small area estimates for Blaby
Mon, 10 Dec 2007 14:24
The Active People Survey is the largest ever survey of sport and active recreation to be undertaken by Sport England in Europe. Key Performance Indicator (KPI) #1 is the numbers of people participating moderately in physical activity for thirty minutes three times a week. This thematic map of Blaby district...

Active People KPI1 small area estimates for Charnwood
Mon, 10 Dec 2007 14:22
The Active People Survey is the largest ever survey of sport and active recreation to be undertaken by Sport England in Europe. Key Performance Indicator (KPI) #1 is the numbers of people participating moderately in physical activity for thirty minutes three times a week. This thematic map of the Charnwood...

Active People KPI1 small area estimates for Harborough
Mon, 10 Dec 2007 14:21
The Active People Survey is the largest ever survey of sport and active recreation to be undertaken by Sport England in Europe. Key Performance Indicator (KPI) #1 is the numbers of people participating moderately in physical activity for thirty minutes three times a week. This thematic map of the Harborough...

Active People KPI1 small area estimates for Hinckley and Bosworth
Mon, 10 Dec 2007 14:19
The Active People Survey is the largest ever survey of sport and active recreation to be undertaken by Sport England in Europe. Key Performance Indicator (KPI) #1 is the numbers of people participating moderately in physical activity for thirty minutes three times a week. This thematic map of Hinckley...

Active People KPI1 small area estimates for Leicester
Mon, 10 Dec 2007 14:14
The Active People Survey is the largest ever survey of sport and active recreation to be undertaken by Sport England in Europe. Key Performance Indicator (KPI) #1 is the numbers of people participating moderately in physical activity for thirty minutes three times a week. This thematic map of Leicester...

Active People KPI1 small area estimates for Melton
Mon, 10 Dec 2007 14:20
The Active People Survey is the largest ever survey of sport and active recreation to be undertaken by Sport England in Europe. Key Performance Indicator (KPI) #1 is the numbers of people participating moderately in physical activity for thirty minutes three times a week. This thematic map of the Melton...

Active People KPI1 small area estimates for North West Leicestershire
Mon, 10 Dec 2007 14:23
The Active People Survey is the largest ever survey of sport and active recreation to be undertaken by Sport England in Europe. Key Performance Indicator (KPI) #1 is the numbers of people participating moderately in physical activity for thirty minutes three times a week. This thematic map of North West...

Active People KPI1 small area estimates for Oadby and Wigston
Mon, 10 Dec 2007 14:22
The Active People Survey is the largest ever survey of sport and active recreation to be undertaken by Sport England in Europe. Key Performance Indicator (KPI) #1 is the numbers of people participating moderately in physical activity for thirty minutes three times a week. This thematic map of Oadby and...

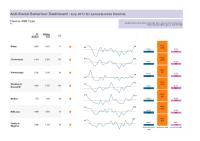
Anti-Social Behaviour Dashboard (April 2013)
Tue, 21 May 2013 12:20
The Anti-Social Behaviour (ASB) data is now available as a fully interactive dashboard in tableau available here.
(N.B. You will need Internet Explorer 8 or above, Google Chrome or latest Firefox to view the dashboard)
A PDF version can be downloaded below.
The ASB Dashboard compares the rolling year- to-date...

Anti-Social Behaviour Dashboard (August 2013)
Mon, 16 Sep 2013 11:07
The Anti-Social Behaviour (ASB) data is now available as a fully interactive dashboard in tableau available here.
(N.B. You will need Internet Explorer 8 or above, Google Chrome or latest Firefox to view the dashboard)
A PDF version can be downloaded below.
The ASB Dashboard compares the rolling year- to-date...

Anti-Social Behaviour Dashboard (Dec 2012)
Thu, 31 Jan 2013 10:21
The Anti-Social Behaviour (ASB) Dashboard provides a visual indication of the number of recorded ASB incidents against the previous year-to-date and long-term average. ASB incidents are broken down into three categories: personal, nuisance and environmental. All seven districts of Leicestershire are...

Anti-Social Behaviour Dashboard (December 2013)
Thu, 16 Jan 2014 14:59
The Anti-Social Behaviour (ASB) data is now available as a fully interactive dashboard in tableau available here.
(N.B. You will need Internet Explorer 8 or above, Google Chrome or latest Firefox to view the dashboard)
A PDF version can be downloaded below.
The ASB Dashboard compares the rolling year- to-date...

Anti-Social Behaviour Dashboard (February 2013)
Fri, 05 Apr 2013 13:57
The Anti-Social Behaviour (ASB) Dashboard provides a visual indication of the number of recorded ASB incidents against the previous year-to-date and long-term average. ASB incidents are broken down into three categories: personal, nuisance and environmental. All seven districts of Leicestershire are...

Anti-Social Behaviour Dashboard (February 2014)
Thu, 13 Mar 2014 15:12
The Anti-Social Behaviour (ASB) data is now available as a fully interactive dashboard in tableau available here.
(N.B. You will need Internet Explorer 8 or above, Google Chrome or latest Firefox to view the dashboard)
A PDF version can be downloaded below.
The ASB Dashboard compares the rolling year- to-date...

Anti-Social Behaviour Dashboard (January 2013)
Tue, 05 Mar 2013 14:18
The Anti-Social Behaviour (ASB) Dashboard provides a visual indication of the number of recorded ASB incidents against the previous year-to-date and long-term average. ASB incidents are broken down into three categories: personal, nuisance and environmental. All seven districts of Leicestershire are...

Anti-Social Behaviour Dashboard (January 2014)
Mon, 10 Feb 2014 15:46
The Anti-Social Behaviour (ASB) data is now available as a fully interactive dashboard in tableau available here.
(N.B. You will need Internet Explorer 8 or above, Google Chrome or latest Firefox to view the dashboard)
A PDF version can be downloaded below.
The ASB Dashboard compares the rolling year- to-date...
Anti-Social Behaviour Dashboard (July 2013)
Thu, 29 Aug 2013 12:10
The Anti-Social Behaviour (ASB) data is now available as a fully interactive dashboard in tableau available here.
(N.B. You will need Internet Explorer 8 or above, Google Chrome or latest Firefox to view the dashboard)
A PDF version can be downloaded below.
The ASB Dashboard compares the rolling year- to-date...

Anti-Social Behaviour Dashboard (June 2013)
Mon, 15 Jul 2013 15:43
The Anti-Social Behaviour (ASB) data is now available as a fully interactive dashboard in tableau available here.
(N.B. You will need Internet Explorer 8 or above, Google Chrome or latest Firefox to view the dashboard)
A PDF version can be downloaded below.
The ASB Dashboard compares the rolling year- to-date...

Anti-Social Behaviour Dashboard (March 2013)
Thu, 02 May 2013 14:29
The Anti-Social Behaviour (ASB) Dashboard provides a visual indication of the number of recorded ASB incidents against the previous year-to-date and long-term average. ASB incidents are broken down into three categories: personal, nuisance and environmental. All seven districts of Leicestershire are...

Anti-Social Behaviour Dashboard (March 2014)
Tue, 29 Apr 2014 14:23
The Anti-Social Behaviour (ASB) data is now available as a fully interactive dashboard in tableau available here. (N.B. You will need Internet Explorer 8 or above, Google Chrome or latest Firefox to view the dashboard).
A PDF version can be downloaded below.
The ASB Dashboard compares the rolling year-...

Anti-Social Behaviour Dashboard (May 2013)
Mon, 15 Jul 2013 15:42
The Anti-Social Behaviour (ASB) data is now available as a fully interactive dashboard in tableau available here.
(N.B. You will need Internet Explorer 8 or above, Google Chrome or latest Firefox to view the dashboard)
A PDF version can be downloaded below.
The ASB Dashboard compares the rolling year- to-date...

Anti-Social Behaviour Dashboard (Nov 2012)
Thu, 31 Jan 2013 10:14
The Anti-Social Behaviour (ASB) Dashboard provides a visual indication of the number of recorded ASB incidents against the previous year-to-date and long-term average. ASB incidents are broken down into three categories: personal, nuisance and environmental. All seven districts of Leicestershire are...

Anti-Social Behaviour Dashboard (Oct 2012)
Thu, 31 Jan 2013 10:12
The Anti-Social Behaviour (ASB) Dashboard provides a visual indication of the number of recorded ASB incidents against the previous year-to-date and long-term average. ASB incidents are broken down into three categories: personal, nuisance and environmental. All seven districts of Leicestershire are...
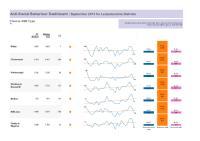
Anti-Social Behaviour Dashboard (September 2013)
Mon, 21 Oct 2013 09:55
The Anti-Social Behaviour (ASB) data is now available as a fully interactive dashboard in tableau available here.
(N.B. You will need Internet Explorer 8 or above, Google Chrome or latest Firefox to view the dashboard)
A PDF version can be downloaded below.
The ASB Dashboard compares the rolling year- to-date...

Blaby Community Safety Partnership Strategic Assessment – October 2011 - September 2012
Thu, 04 Jul 2013 13:06
The Partnership Strategic Assessment for Blaby District brings together information regarding crime, disorder and community safety issues from across partner agencies to identify the longer-term issues impacting within the district as well as the scope of, and projections for crime, criminality and other...

Blaby Community Safety Partnership Strategic Assessment – October 2012 - September 2013
Fri, 14 Feb 2014 10:48
The Partnership Strategic Assessment for Blaby District brings together information regarding crime, disorder and community safety issues from across partner agencies to identify the longer-term issues impacting within the district as well as the scope of, and projections for crime, criminality and other...
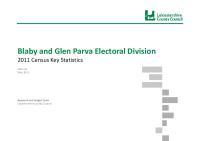
Blaby Electoral Divisions - 2011 Census Key Stats
Wed, 29 May 2013 15:19
These reports provide a broad overview of the 2011 Census Key Statistics data, released by the Office for National Statistics on 30th January 2013, as part of the Census Second Release. The reports summarise a selection of key headline datasets of this release for Leicestershire Electoral Divisions (EDs)....

Black Enterprise Leicestershire 2009
Wed, 15 Apr 2009 09:31
African Caribbean Citizens Forum (ACCF) commissioned this report to research Black owned enterprises in selected towns across Leicestershire with a view to establishing a feel for their number, gender participation and survival rates. ACCF also wanted to understand the kinds of barriers to start-up faced...

The second phase of the 2011 Census Second Release was released on December 11th. This release includes a range of socio-economic data at national, regional and local authority level. This report summarises the key findings of this release for Leicestershire by the following broad themes:
- Age, Sex and...

Census 2011 - LSOA population by sex and five year age bands
Mon, 18 Feb 2013 14:25
Leicestershire County Council
The following interactive dashboard contains information on population for Leicestershire Lower Super Output Areas (LSOAs).
Census 2011 LSOA population dashboard by sex and quinary age (N.B. requires Internet Explorer 8 and above or comparable browser).
LSOAs are small units of geography (containing, on...

Census 2011 - Transport
Mon, 23 Sep 2013 16:00
On January 30th, 2013, ONS released a range of data from the 2011 Census at a small area level. The report and interactive dashboards below analyse data from the two transport-related census questions:
- Car and Van Availability
- Method of Travel to work
The first dashboard presents data from both questions...

Charnwood Electoral Divisions - 2011 Census Key Stats
Wed, 29 May 2013 15:19
These reports provide a broad overview of the 2011 Census Key Statistics data, released by the Office for National Statistics on 30th January 2013, as part of the Census Second Release. The reports summarise a selection of key headline datasets of this release for Leicestershire Electoral Divisions (EDs)....

Children & Families Performance Dashboards Q1 2017-18
Mon, 11 Sep 2017
Leicestershire County Council - Children & Families Performance Dashboards Q1 2017-18.
The dashboard and associated report provide an update on the performance of Leicestershire County Council's Children & Families Department. The dashboard covers children's social care services (including child...

Children & Families Performance Report Q1 2017-18
Mon, 11 Sep 2017
Leicestershire County Council - Children & Families Performance Report Q1 2017-18.
The report and associated dashboard provide an update on the performance of Leicestershire County Council's Children & Families Department. The report covers children's social care services (including child protection,...

Children and Family Services – Care Placement Strategy 2018-2021
Wed, 03 Oct 2018
Leicestershire County Council
In Leicestershire we are ambitious for our children and want to do all we can to provide them with high quality services. For our children in care we will provide good quality care and placements to help them reach their potential. The Care Placement Strategy outlines the county council's ambition for...

Children’s Social Care Needs Analysis : Understanding Service User Need using Cluster Analysis
Sat, 01 Nov 2014
Leicestershire County Council
In order to identify and understand the key service users groups for Children's Social Care Services in Leicestershire cluster analysis was undertaken using Children's Social Care Assessments data completed between 01/04/2014 and 17/09/2014 for the Children and Family Services department, Leicestershire...
The Common Mental Health Disorders Dashboard, collated by Public Health England, collates and analyses a wide range of publically available data on prevalence, risk, prevention, early intervention, assessment, treatment, outcomes and service costs. It provides commissioners, service providers, clinicians,...

Community Based Survey Results 2012/13 Q3
Fri, 01 Feb 2013 14:17
Leicestershire County Council and Leicestershire Police Authority have jointly commissioned the Community Based Survey, which replaces the previous community safety CRAVE Survey. The project combines key survey requirements of the County Council and Police Authority together into one consultation. As...
Credit Crunch Report April 2009
Mon, 27 Apr 2009
This April report analyses a range of up to date information to assess the local impact of the credit crunch in Leicester and Leicestershire within the context of the national economic downturn. This month's report features newly developed dashboards to compare change over time on claimant, vacancy and...

Credit Crunch Report December 2008
Fri, 19 Dec 2008
This report, to be produced monthly, uses a range of information to assess the local impact of the credit crunch in the context of the national economic downturn. The report uses local datasets such as claimant data, housing sales and business optimism. Each month new data will be included to monitor...